<prefix>:<type>:<additional_info>
Got feedback? Additional questions? Just want to have a friendly chat?
Get in touch!
What is the data properties file?
Before you can upload any data files to data set, you need to tell the platform how your data is structured. For example, you need to tell the platform where an identifier or a timestamp is stored, which properties you want to include, the data type of each property, etc.
This can be done through the web UI, but also by uploading a data properties file which describes your data.
This data properties file is a .csv file where each row specifies what kind of data a property in your data files contains.
The contents of the data properties file
There are 2 kind of data properties file:
-
A data properties file that describes the structure of index-based files like CSV. A property in such an index-based file is accessed through its index, for example the property at column 3.
-
A data properties file that describes the structure of name-based files like GeoJSON, SHP, or Parquet. A property in such a name-based file is accessed through its name, for example the property with name 'speed'.
The syntax used in both types is the same, but the structure is slightly different.
For each property, the data properties file describes the following:
-
Property identifier: how/where to find the property. This will either be an index or a name.
-
Display Name (string): the display name used to provide a human-readable name for the property. This name will be shown in the UI.
-
Type (string with special syntax): the type of the data property. This is used to indicate which property contains the id, location, timestamp, … and to specify whether a property is a numeric property, a category (enum), or text. See the next section for the syntax.
-
Description (string): a human-understandable description of what the property represents. This is for example used in tooltips in the UI.
-
Include for analysis (boolean: true or false): only properties that are included for analysis can be used for filtering and styling. If you set this to false for the field that corresponds to the id of your records, your users will not be able to style by the id, filter by the id, or see an overview of the visible asset ids. This can be useful when privacy is a concern.
-
Accuracy value (number): the analytics engine rounds numeric properties down to the nearest multiple of the accuracy value. For example if the property represents the length of a ship in meters, using a value of 0.1 for the accuracy value will tell the analytics engine to work with values with 1 digit after the decimal point. For example, a length value 2.31 will then be rounded down to 2.3. The larger the accuracy value, the more compression the platform can perform and the better the performance. This is especially important for larger data sets. This setting is only used for numeric properties. It is also ignored for mandatory properties (such as identifiers, locations and timestamps).
-
No data value (number, string or empty): some data sets use a special value to indicate that the actual value for a property is unknown or not set.
-
Minimum valid value (number or empty): when specified for a numeric property, all values below this value will be considered as unknown or not set. This setting is only used for numeric properties. It is also ignored for the mandatory properties (id, location and timestamp).
-
Maximum valid value (number or empty): when specified for a numeric property, all values above this value will be considered as unknown or not set. This setting is only used for numeric properties. It is also ignored for the mandatory properties (id, location and timestamp).
Data properties file for describing index-based files structure (CSV)
Index-based data property files are used before uploading CSV files (e.g., during Movement data, movement path data, time-series data set,… creation).
The data properties .csv files have the following columns to describe the properties:
Display name |
Type |
Description |
Include |
Accuracy |
No data value |
Min valid value |
Max valid value |
Note that this doesn’t include the property identifier.
That one is implicit: The first row in the data properties .csv file describes the first property, the second row the second, etc. .
Example
The following is an example of a data properties file for index-based files (you can download the .csv version here):
MMSI |
id:long |
unique identifier |
TRUE |
0 |
|||
time |
time:yyyy-MM-dd’T’HH:mm:ss |
time string |
FALSE |
0 |
|||
latitude |
y:float |
y-coordinate |
FALSE |
0 |
|||
longitude |
x:float |
x-coordinate |
FALSE |
0 |
|||
Speed over Ground |
float |
Speed over Ground |
TRUE |
1 |
102.3 |
||
Course over Ground |
float |
Course over Ground |
TRUE |
1 |
360.0 |
||
Heading |
heading:float |
Heading |
TRUE |
1 |
511 |
0 |
360 |
Vessel name |
string |
Name of the vessel |
FALSE |
0 |
|||
IMO |
string |
IMO |
FALSE |
0 |
|||
Callsign |
string |
Callsign |
FALSE |
0 |
|||
Vessel type |
enum |
VesselType |
TRUE |
0 |
|||
Status |
enum |
Status |
TRUE |
0 |
|||
Length |
length:float |
length |
TRUE |
0.1 |
0 |
||
Width |
width:float |
width |
TRUE |
0.1 |
0 |
||
Draft |
float |
Draft |
TRUE |
0.1 |
0 |
||
Cargo |
float |
Cargo |
TRUE |
1 |
In the above example, the line
Heading |
heading:float |
Heading |
TRUE |
1 |
511 |
0 |
360 |
indicates that the corresponding property (e.g. a column in a CSV file)
-
Should use Heading as display name in the xyzt.ai platform
-
Contains numbers that are stored as floats and that represent a heading
-
The description to use for that column is also Heading
-
The column should be included in the analytics
-
The accuracy value for this numeric property is 1, all heading values are rounded down to the nearest integer
-
When the value of the property is 511, it should be interpreted as "no data"
-
Only values in the interval [0,360] are valid values
and since the property is specified on row 7, the property identifier (=the index) is 7, i.e., it applies to the 7th column in the CSV file.
Notes for nested Parquet properties
Parquet files can contain nested structures, such as nested records and lists of records. In such cases, the Property identifier should use dot notation to refer to nested fields.
Examples:
-
device.idrefers to the fieldidinside the nested recorddevice -
point.xrefers to the fieldxinside the nested recordpoint -
points.tsrefers to the fieldtsinside each element of the repeated recordpoints
When a Parquet file contains a list of nested records, the platform expands that list into multiple logical records, one for each element in the list.
For example, when a Parquet record contains a field points with multiple entries, and your data properties file refers to points.x, points.y, and points.ts, then each element in points is treated as a separate observation.
Nested Parquet identifiers should always refer to the logical field names.
You should not include internal Parquet wrapper names such as list or element in the property identifier.
For example, use points.ts rather than points.list.element.ts.
When defining movement data in Parquet, you still need to define all mandatory properties such as an id: field, a time field, and coordinates (x: and y:) where applicable.
The fact that these fields are nested does not change the required semantics; only the property identifier changes.
|
Data properties file for describing a name-based file structure (Parquet, GeoJSON, SHP)
GeoJSON and SHP files are used when creating Geometry and Time-series data sets. Parquet files can be used when creating all possible data set types.
The data properties .csv files for GeoJSON, SHP, and Parquet files have the following columns to describe the properties:
Property identifier |
Display name |
Type |
Description |
Accuracy |
No data value |
Min valid value |
Max valid value |
Note that this doesn’t include the include for analysis flag. That one is implicit: You only specify the properties that you want to include, and leave out all the others.
Example
The following is an example of a data properties file for index-based files.
For readability, it is displayed as a table and not as a .csv file (but you can download the .csv version here):
mmsi |
MMSI |
id:long |
unique identifier |
0 |
|||
t_recording |
time |
time:yyyy-MM-dd’T’HH:mm:ss |
time string |
0 |
|||
lat |
latitude |
y:float |
y-coordinate |
0 |
|||
lon |
longitude |
x:float |
x-coordinate |
0 |
|||
speed_over_ground |
Speed over Ground |
float |
Speed over Ground |
1 |
102.3 |
||
course_over_ground |
Course over Ground |
float |
Course over Ground |
1 |
360.0 |
||
heading |
Heading |
heading:float |
Heading |
1 |
511 |
0 |
360 |
v_type |
Vessel type |
enum |
VesselType |
0 |
|||
status |
Status |
enum |
Status |
0 |
|||
length |
Length |
length:float |
length |
0.1 |
0 |
||
width |
Width |
width:float |
width |
0.1 |
0 |
||
draft |
Draft |
float |
Draft |
0.1 |
0 |
||
cargo |
Cargo |
float |
Cargo |
1 |
In the above example, the line
heading |
Heading |
heading:float |
Heading |
1 |
511 |
0 |
360 |
indicates that the corresponding property
-
Is identified by
headingin your (meta)data files -
Should use Heading as display name in the xyzt.ai platform
-
Contains numbers that are stored as floats and that represent a heading
-
The description to use for that property is also Heading
-
The accuracy value for this numeric property is 1, all heading values are rounded down to the nearest integer
-
When the value of the property is 511, it should be interpreted as "no data"
-
Only values in the interval [0,360] are valid values
And since the property is specified, it must be included for analytics.
Syntax of the type property
The type property definition consists out of 3 parts:
Prefix part
Common
The following prefixes can be used for all types of data sets, except for Point Data sets.
-
id:use this prefix for the property representing the identifier of the record. There can be only one property defined as the id.Note that Point Data sets don’t use an id, so you cannot use this prefix for Point Data sets.
Movement data sets
The following prefixes can in addition be used for movement data sets.
-
x:use this prefix for the property representing the WGS84 longitude coordinate in degrees form (e.g., 179.0523).In case your data uses a different coordinate reference system, you can specify this as additional info. There can be only one property defined as the x coordinate.
-
y:use this prefix for the property representing the WGS84 latitude coordinate in degrees form (e.g., 50.0234).In case your data uses a different coordinate reference system, you can specify this as additional info. There can be only one property defined as the y coordinate.
-
z:use this prefix for an elevation expressed as meters above sea level. It is used for 3D coordinates, for example when tracking air tracks. There can be only one property defined as the z coordinate. -
width:,length:: use the prefixes for the properties representing the width and length of the asset. The visual analytics page uses these properties to scale the icons that represent the current position of the asset.The platform assumes these properties are expressed in meters.
-
toFront:,toBack:,toLeft:,toRight:use the prefixes if the relative position of the sensor recording the location of the asset is known.Sometimes the location-recording sensor is located off-center. For large assets like container ships, this additional offset can introduce an error of several meters on the location of the asset. When the data exposes this offset, the platform can compensate for it.
The following image illustrates how the platform interprets the different options:
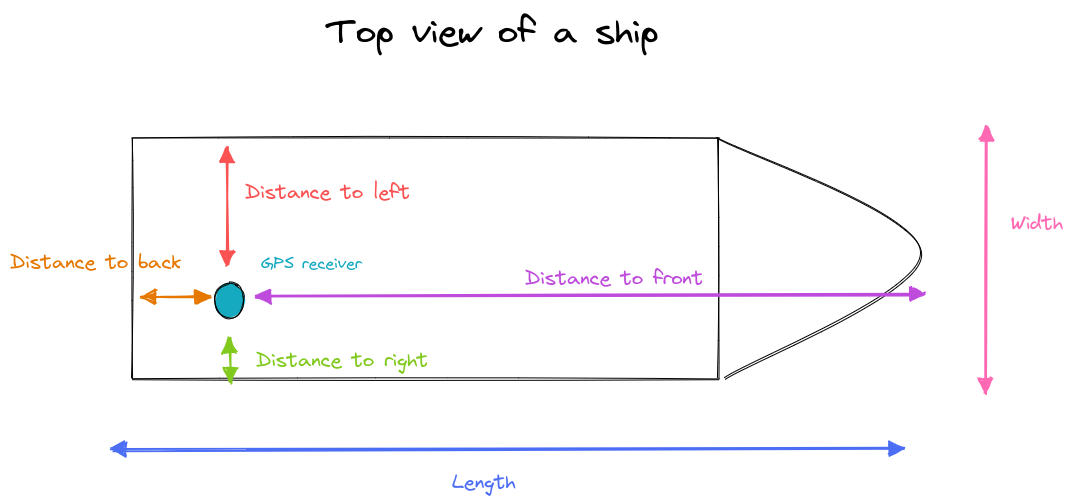 Figure 1. The relation between the different properties and the location of the sensor
The platform assumes these properties are expressed in meters.
-
heading:use this prefix for a heading expressed in degrees clockwise from the north.
Point data sets
The prefixes for points data sets are x:, y: and z:, with the same semantics as described in the movement data sets section.
Geometry data sets
Geometry data sets contain static (i.e., non-timevarying) data, such as roads, neighborhoods in a city, etc. Such data sets can be large and we allow to define a Priority Level property:
-
priorityLevel:: use this prefix for the property representing a priority. A priority of 1 means that the feature (e.g., a road, a neighborhood polygon, etc.) will be shown always, also when zoomed out. Use higher numbers (2,3,4…) in your data to denote features that are less important.Examples:
-
Road networks: Prepare your data so that roads of type
motorwayandtrunkhave priority level 1,primaryroads level 2, andsecondaryroads level 3, etc. -
Demographic areas: Prepare your data so that
continentshave priority level 1,countriespriority level 2,statespriority level 3,municipalitiespriority level 4, etc.
-
When working with road networks, the platform also allows you to specify a Reverse ID property, pointing to the feature identifier of the opposing road direction:
-
reverseId:: use this prefix to specify the property that contains the id of the counterpart road direction, for two-way roads.Example:
-
A common approach to work with two-way roads is to define road segments using an identifier of the form
294733234_0and adding a property to the GeoJSON feature with name for instanceotherIdand value-294733234_0, using a negative id to indicate the complement direction.
-
Finally, following additional Display Name prefix can be used for geometry data as well:
-
displayname:use this prefix for the property that contains a human-readable name of the feature (i.e., road, area,…). The value of this property will be shown in the UI.For example, if you have a GeoJSON file defining roads where each road has properties like:
{
  "properties": {
    "road_id": "2343242_0",
    "road_name": "Memorial Drive"
  }
}
While the
road_idproperty is used asid(and also used in the time-varying.csvfiles to indicate which road the time series value applies to), you don’t want that"2343242_0"to show in the UI when referring to that road. Instead, you’ll want to use the value of theroad_nameproperty, which is done by marking it as thedisplayname:.There can be at most one property defined as the display name. When none of the properties are marked as such, the id property will be used as display name.
Movement path data sets
Movement path data sets are similar to movement data sets with following exceptions:
-
Movement path data sets reference a GeoJSON data set for the geometries or features. For instance, the GeoJSON data set contains the road network segments.
-
Movement path data itself references a feature in the GeoJSON data set as opposed to containing longitude and latitude point location coordinates. Hence the prefixes x:, y:, z: do not apply.
-
The special prefixes such as heading:, width:, length:, toFront:, toBack:, toLeft:, and toRight. do not apply to movement path data sets.
Movement path data sets, require an identifier of the asset (vehicle, trip,…) that is moving using the id: prefix, a timestamp, and a reference to the geometry feature:
-
geometryId: The identifier of the feature in the movement path’s referenced GeoJSON data set, indicating on which feature the asset (or trip) is at a certain time.
Time-series data sets
The following prefixes can be used for time series data sets.
-
displayname:use this prefix for the property that contains a human-readable name of the area or measurement device. The value of this property will be shown in the UI.Similar to GeoJSON data, if you have a GeoJSON file defining sensors where each feature or sensor has properties like:
{
  "properties": {
    "sensor_id": "DGWBETLJGDIUTEDSG",
    "sensor_name": "Kitchen sensor"
  }
}
You can use the value of the
sensor_nameproperty as display name instead of the sensor_id, which is done by marking it as thedisplayname:. -
priorityLevel:: use this prefix for the property representing a priority. A priority of 1 means that the feature (e.g., a road, a neighborhood polygon, etc.) will be shown always, also when zoomed out. Use higher numbers (2,3,4…) in your data to denote features that are less important. -
reverseId:: For road network time-series data, use this prefix to specify the property that contains the id of the counterpart road direction, for two-way roads.
Precomputed origin-destination time series data sets
The following prefixes are required for precomputed origin-destination time series data sets:
-
originId:: use this prefix to define a property pointing to the id of the origin geometry in the geometry table. Accepted types are all integer-based types and string-based types. -
destinationId:: similarly, use this prefix to define a property pointing to the id of the destination geometry in the geometry table.
| Precomputed origin-destination time series data sets are only supported by database data sets. |
See Precomputed origin-destination time series for more details on how precomputed origin-destination time series work.
Database data sets
Database datasets have columns containing the geometry of the assets, and these should be listed in the data properties file:
-
geometry: use this prefix for the database column containing the actual geometry. This column is required for all database types. The type of geometry (point, linestring, polygon, …) is specified in the type part, the encoding and georeference in the additional info part. The complete syntax is as follows:geometry:<geometryType>:<geometryEncoding>:<coordinateReference>-
geometryType: specifies the type of geometries, This should be one ofpoint,lineString,polygon,multiLineString,multiPolygonorgeometry, and should match what’s specified in the table structure. -
geometryEncoding: specifies how the geometries are encoded. Currently alwaysdefault. The actual default encoding depends on the database type; it typically corresponds to the preferred/native representation of geospatial data in the database. See the page on databases for more details. -
coordinateReference: the code used to reference the spatial coordinate system in which the coordinates of the geometries are expressed. Should always start withEPSG:, followed by the EPSG code (e.g.EPSG:4326).
-
-
geometryBbox: use this prefix for the database column containing the bounding box of the geometry. This is only required (and allowed) for ClickHouse databases - Postgis databases natively support spatial queries and don’t require an explicit bounding box column.geometryBbox:<geometryType>:<geometryEncoding>:<coordinateReference>-
geometryType: alwaysbounds. -
geometryEncoding: specifies how the bounds are encoded. Currently alwaysdefault. The actual default encoding depends on the database type; it typically corresponds to the preferred/native representation of geospatial data in the database. See the page on databases for more details. -
coordinateReference: the code used to reference the spatial coordinate system in which the coordinates of the bounds are expressed. Should always start withEPSG:, followed by the EPSG code (e.g.EPSG:4326).
-
Type part
The type is one of the following: time, string, float, double, short, int, long or enum.
-
time: indicates that this property contains the time stamp of the records. There can only one property defined as the timestamp. -
string: indicates that this property contains text. -
float: indicates that this property contains a single precision (32 bit) floating point number. -
double: indicates that this property contains a double precision (64 bit) floating point number. -
short:: indicates that this property contains a half precision (16 bit) integer number in the range [-32768, 32767]. -
int: indicates that this property contains a single precision (32 bit) integer number in the range [-2147483648, 2147483647]. -
long: indicates that this property contains a single precision (64 bit) integer number. -
enum: indicates that this property contains a values that are categories or enumerations.For example different brands of a car, or types of a vessel. -
point: indicates that this property contains a point geometry. -
lineString: indicates that this property contains a line string geometry. -
polygon: indicates that this property contains a polygon geometry. -
multiLineString: indicates that this property contains a composite line string geometry. -
multiPolygon: indicates that this property contains a composite polygon geometry. -
bounds: indicates that this property contains a rectangular bounds objects.
You can use the following flowchart to assist you in selecting the correct type:
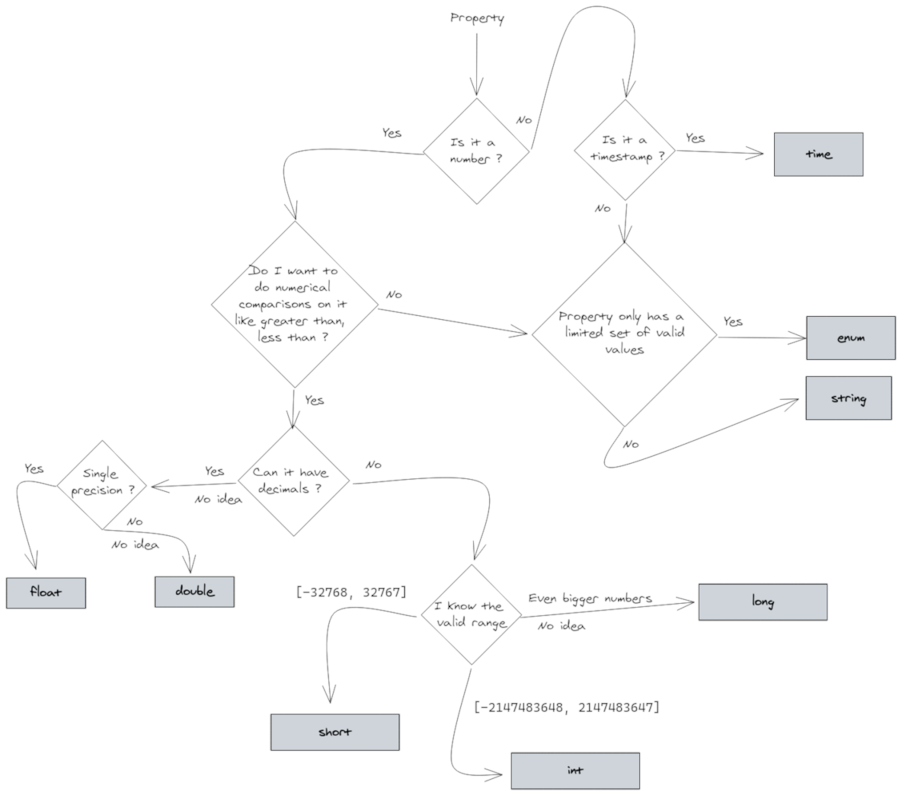
Figure 2. Flowchart to assist you in selecting the correct type
Additional info part
Some properties allow specifying additional info:
-
When the
x:andy:coordinates are expressed in a different coordinate reference system, you specify the EPSG code as additional info.For example
x:float:EPSG:4269andy:float:EPSG:4269 -
The platform tries to auto-detect the time format for the
timeproperty. However, if the format is known, it can be specified by defining the pattern as additional info.For example
time:yyyy-MM-dd’T’HH:mm:ss.The syntax for the patterns is documented here.
Got feedback? Additional questions? Just want to have a friendly chat?
Get in touch!