Got feedback? Additional questions? Just want to have a friendly chat?
Get in touch!
What is shown on the origin-destination page?
The origin-destination page uses matrices to show you statistics on:
-
How many assets moved from location A to location B in a certain time period
-
What the median or average travel time was from location A to location B in a certain time period
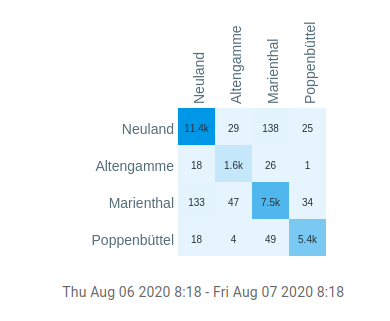
Figure 1. Example of an origin-destination matrix showing the number of trips between locations
You can do this analysis for a single time period, or compare two time periods side-by-side and see the difference between those time periods.
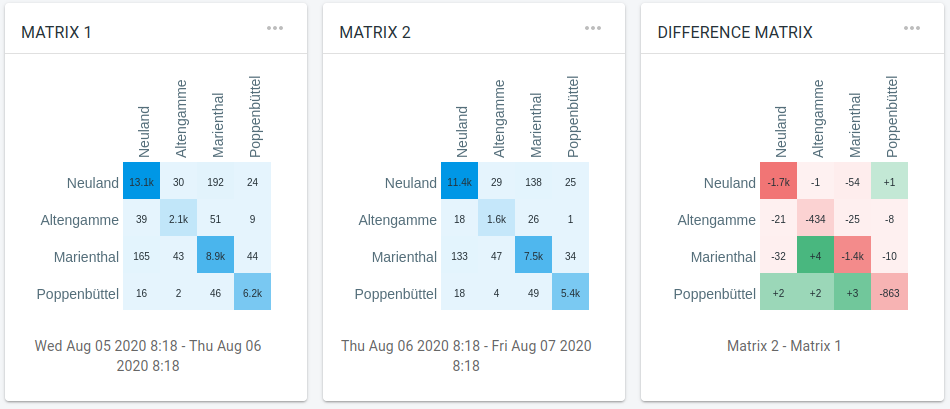
Figure 2. The origin-destination matrices of 2 time periods side-by-side, as well as the difference matrix
How to read an origin destination matrix?
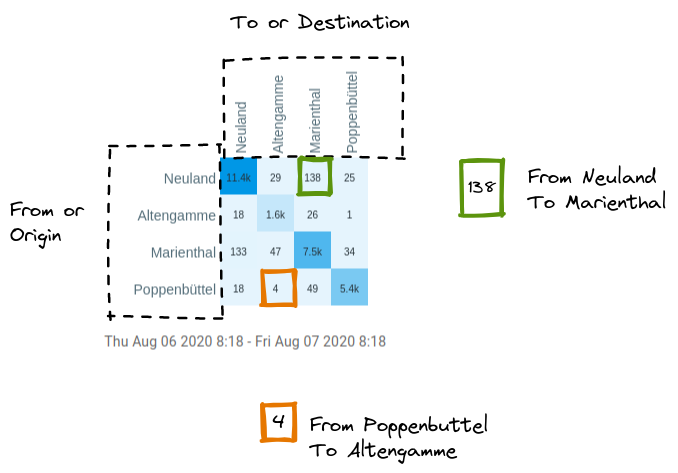
Figure 3. The left side of the matrix lists the origin locations, the top side the destination locations
In the example above, the traffic flow is analyzed between Neuland, Altengamme, Marienthal and Poppenbuttel. The labels on the left are the originating areas, the labels at the top the destination areas. In an origin destination matrix, these labels are identical, and one analyzes for each pair of selected areas how many move from the first to the second.
For example
-
4 assets traveled from Poppenbuttel to Altengamme in the selected time period
-
138 assets traveled from Neuland to Marienthal in that same time period
More formally: Cell (row i, column j) shows the traffic from the area at row i to the area at column j.
|
The matrix is asymmetrical
Most of the time, the amount of traffic going from A to B is not the same as the traffic going from B to A. Therefore, most origin-destination matrices are asymmetrical. |
Data requirements
You need a movement data set with records that define "trips" or "journeys": each record with the same id belongs to the same trip.
You cannot perform origin destination analysis when the id’s of your records change for every record.
In case the identifiers of your records do not correspond to trips, but to for example an individual vessel and if that vessel moves multiple times between the origin and the destination in the selected time period, that vessel will only be counted once.
Origin destination analysis is not supported for time series data sets.
Got feedback? Additional questions? Just want to have a friendly chat?
Get in touch!