Got feedback? Additional questions? Just want to have a friendly chat?
Get in touch!
Introduction to extracting data sets from a data store
You cannot directly use and analyze the data that is present in a data store. The data store only serves as a container to store all your data.
If you want to analyze the data, you need to select a subset of it (for example by specifying a time or location filter), and this subset will be extracted in a data set.
That data set is no different from a regular data set, and can be included in a project and analyzed.
There are two ways to extract data from a data store:
-
Quick extraction: here you can define spatial, temporal and property based filters to define which data you want to extract.
-
Advanced extraction: Besides all the features offered by the quick extraction functionality, you can also draw shapes to use as spatial filter or area of interests.
Quick extraction
In the quick extraction, you select the subset of data to extract through a filter.
You can use all functionality you’re familiar with from the Visual Analytics page, except that you cannot use areas defined externally (drawn on a map or from an area of interest layer).
That also implies you cannot create from, through and/or to filters, as there are no areas available.
Step 1: Navigate to the quick extract page
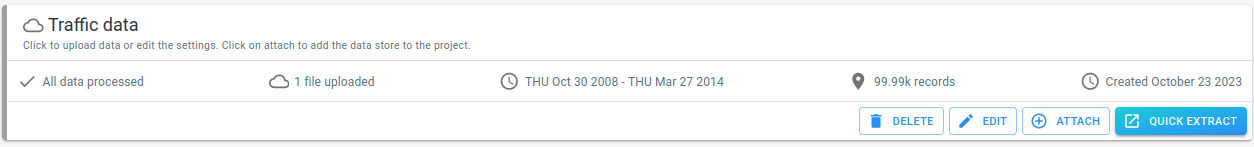
Click on the Quick Extract button on the data store card:
Figure 1. The Data store card with the Quick Extract button
This will open the quick extraction page.
Step 2: Configure the filters
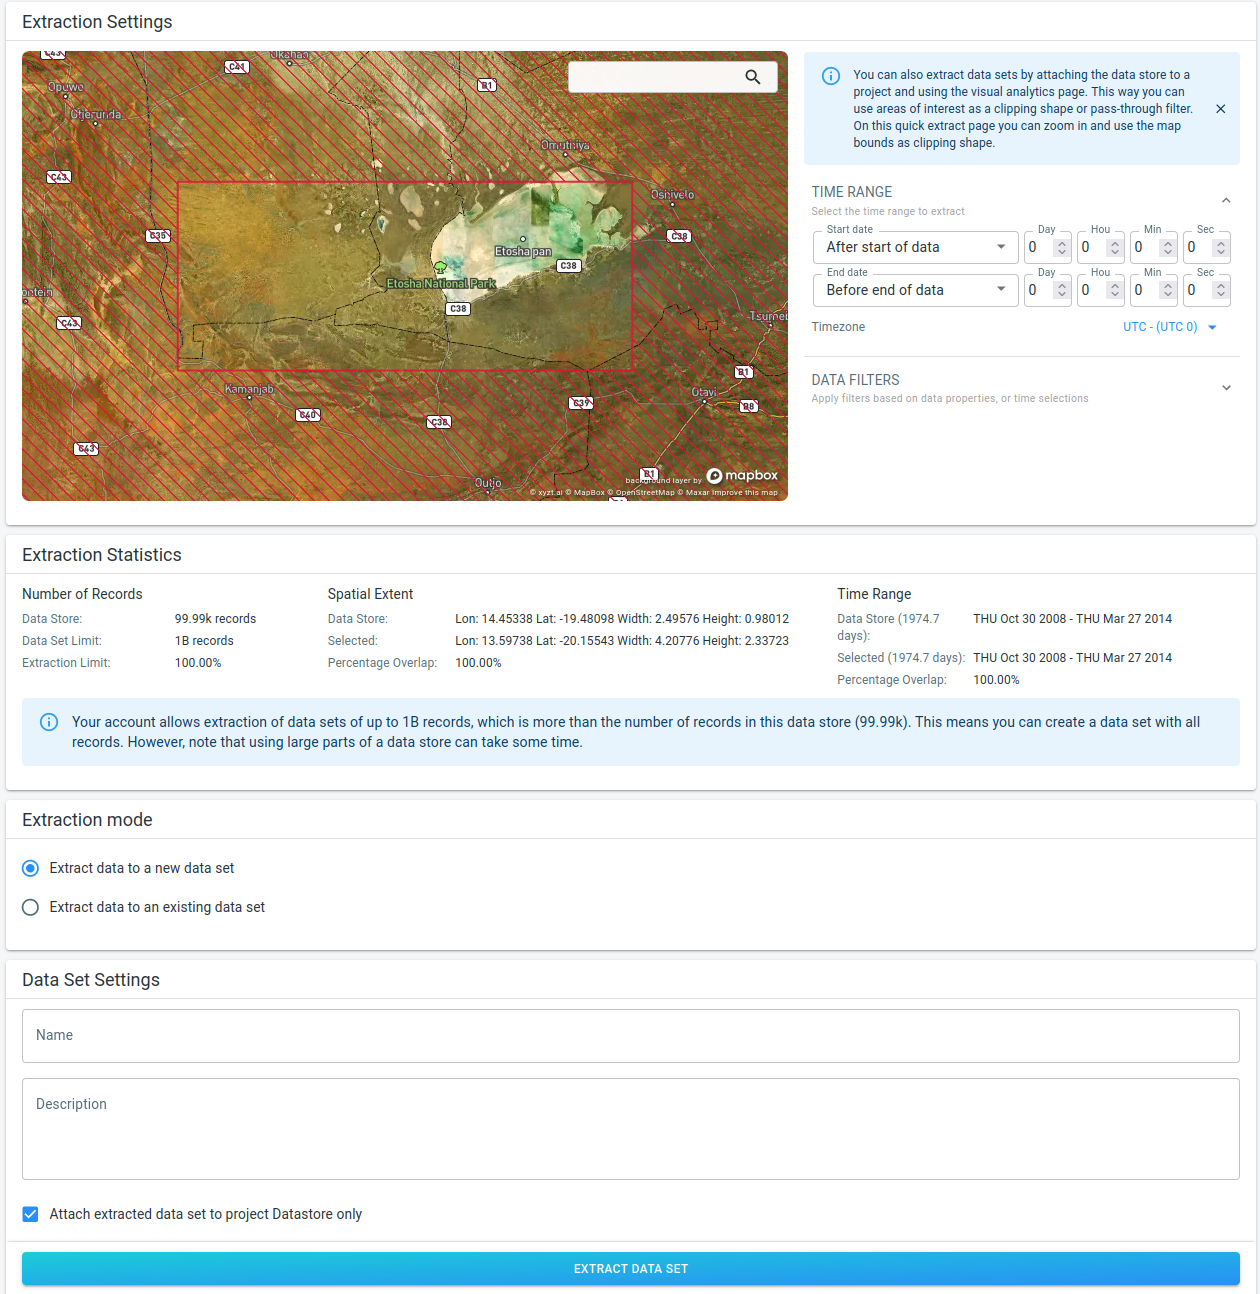
Figure 2. The quick extract page
In the Extraction Settings part at the top of the UI, you configure the filter:
-
The spatial map has two functions.
-
It shows the spatial bounds of the data store, on top of MapBox satellite imagery to provide context. The areas where there is no data are hatched with a red diagonal line pattern.
-
It acts as a spatial filter during the extraction. Only the data corresponding to the visible part of the map will be retained during extraction.
-
-
The Time Range panel is the same panel as on the other analytics pages, and allows to configure a time filter. The time filter can be configured using absolute times, or times relative to the temporal bounds of the data store.
-
The Data Filters panel allows to configure additional filters for extraction. Again, this is the same UI as on the analytics pages, and allows for example to filter out data based on properties.
In the Extraction Statistics part, you find statistics on both the data store and the part that is going to be extracted into a separate data set. It provides guidance on the expected size of the extracted data set. Note that the exact number of records cannot be provided, but this part provides an indication of the spatial and temporal overlap.
The Extraction mode panel gives you the option to extract the data to a new data set, or rather to an existing compatible one. Note that this panel will only appear if compatible data sets exists. A compatible data set is one with the exact same properties as the data store. Otherwise, the extraction will always happen to a new data set.
The contents of the Data Set Settings panel at the bottom depend on the extraction mode. This panel allows you to configure the name and description of the data set that will be created during extraction, or allows you to select the existing data set to which you want to add the extracted data.
Advanced extraction
Advanced extraction allows to include areas in the filter, both hand drawn and areas of interest.
You do this by attaching the data store to a project, and do the extraction on the visual analytics page. This allows to use all available functionality of the visual analytics page, including the drawing of shapes or referring to areas of interest.
Step 1: Attach the data store to a project
Use the Attach button on the data store card to attach it to a project.
Figure 3. The Data store card with the Attach button
|
You need to keep the data store attached to the project until the extraction is finished. Similarly, you need to keep any areas you use in your filter in the project until the extraction is finished. As such, creating a separate project that you use just for extractions is recommended. |
Step 2: Use the visual analytics page to configure the filters
Use the:
-
Spatial map to configure the spatial filter of the data store
-
Timeline to configure the temporal filter of the data store
-
The filter UI in the layer control to configure the property based filter of the data store
Once you’ve configured all those filters, you press the Extract button in the layer control:

Figure 4. The extract button in the layer control (only available for data stores)
This will open a dialog where you configure the settings for the data set to which the extracted data will be added:

Figure 5. The dialog to configure the settings for the data set
|
The spatial map bounds serve as a spatial filter. Keep in mind that the visible area on the map defines a spatial bounds that will be used during extraction as a filter. This also means that when you define a through filter using a shape on the map, that both spatial filters will be combined and your data will be clipped to the map bounds. If you need all data of all assets passing through the through filter, make sure to fit the map on the data store bounds. |
Got feedback? Additional questions? Just want to have a friendly chat?
Get in touch!