Got feedback? Additional questions? Just want to have a friendly chat?
Get in touch!
What is route analysis?
Route analysis is a way to inspect and compare values along a specific path in a road network (a “route”), rather than aggregating across an entire area.
A route is built from connected line segments (typically road segments). Once you have a route, you can analyze it by different attributes, for example:
-
Number of trips along the route
-
Average speed along the route
-
Travel time or other numeric attributes you have available
Route analysis is especially useful for corridor-style questions like:
-
“Where along this corridor do we see lower speeds?”
-
“When does congestion occur, and on which part of the route?”
-
“How does traffic volume vary from segment to segment?”
From data to insights
The different steps required to go from your data to route insights are:
-
Create a Geometry or Time Series data set using line shapes with connectivity information.
-
Create routes on the resulting (road) network on the visual analytics page.
-
Use the route analysis capability of the visual analytics page
The sections below (and the next articles) walk through each step in detail.
-
Prepare the network dataset
Your road-network lines must include connectivity information (start node id and end node id) so that segments can be chained into a graph on which routes can be computed.
-
Create routes
Use the route creation tool to click connected segments in the map and save the resulting route. Saved routes are reusable.
-
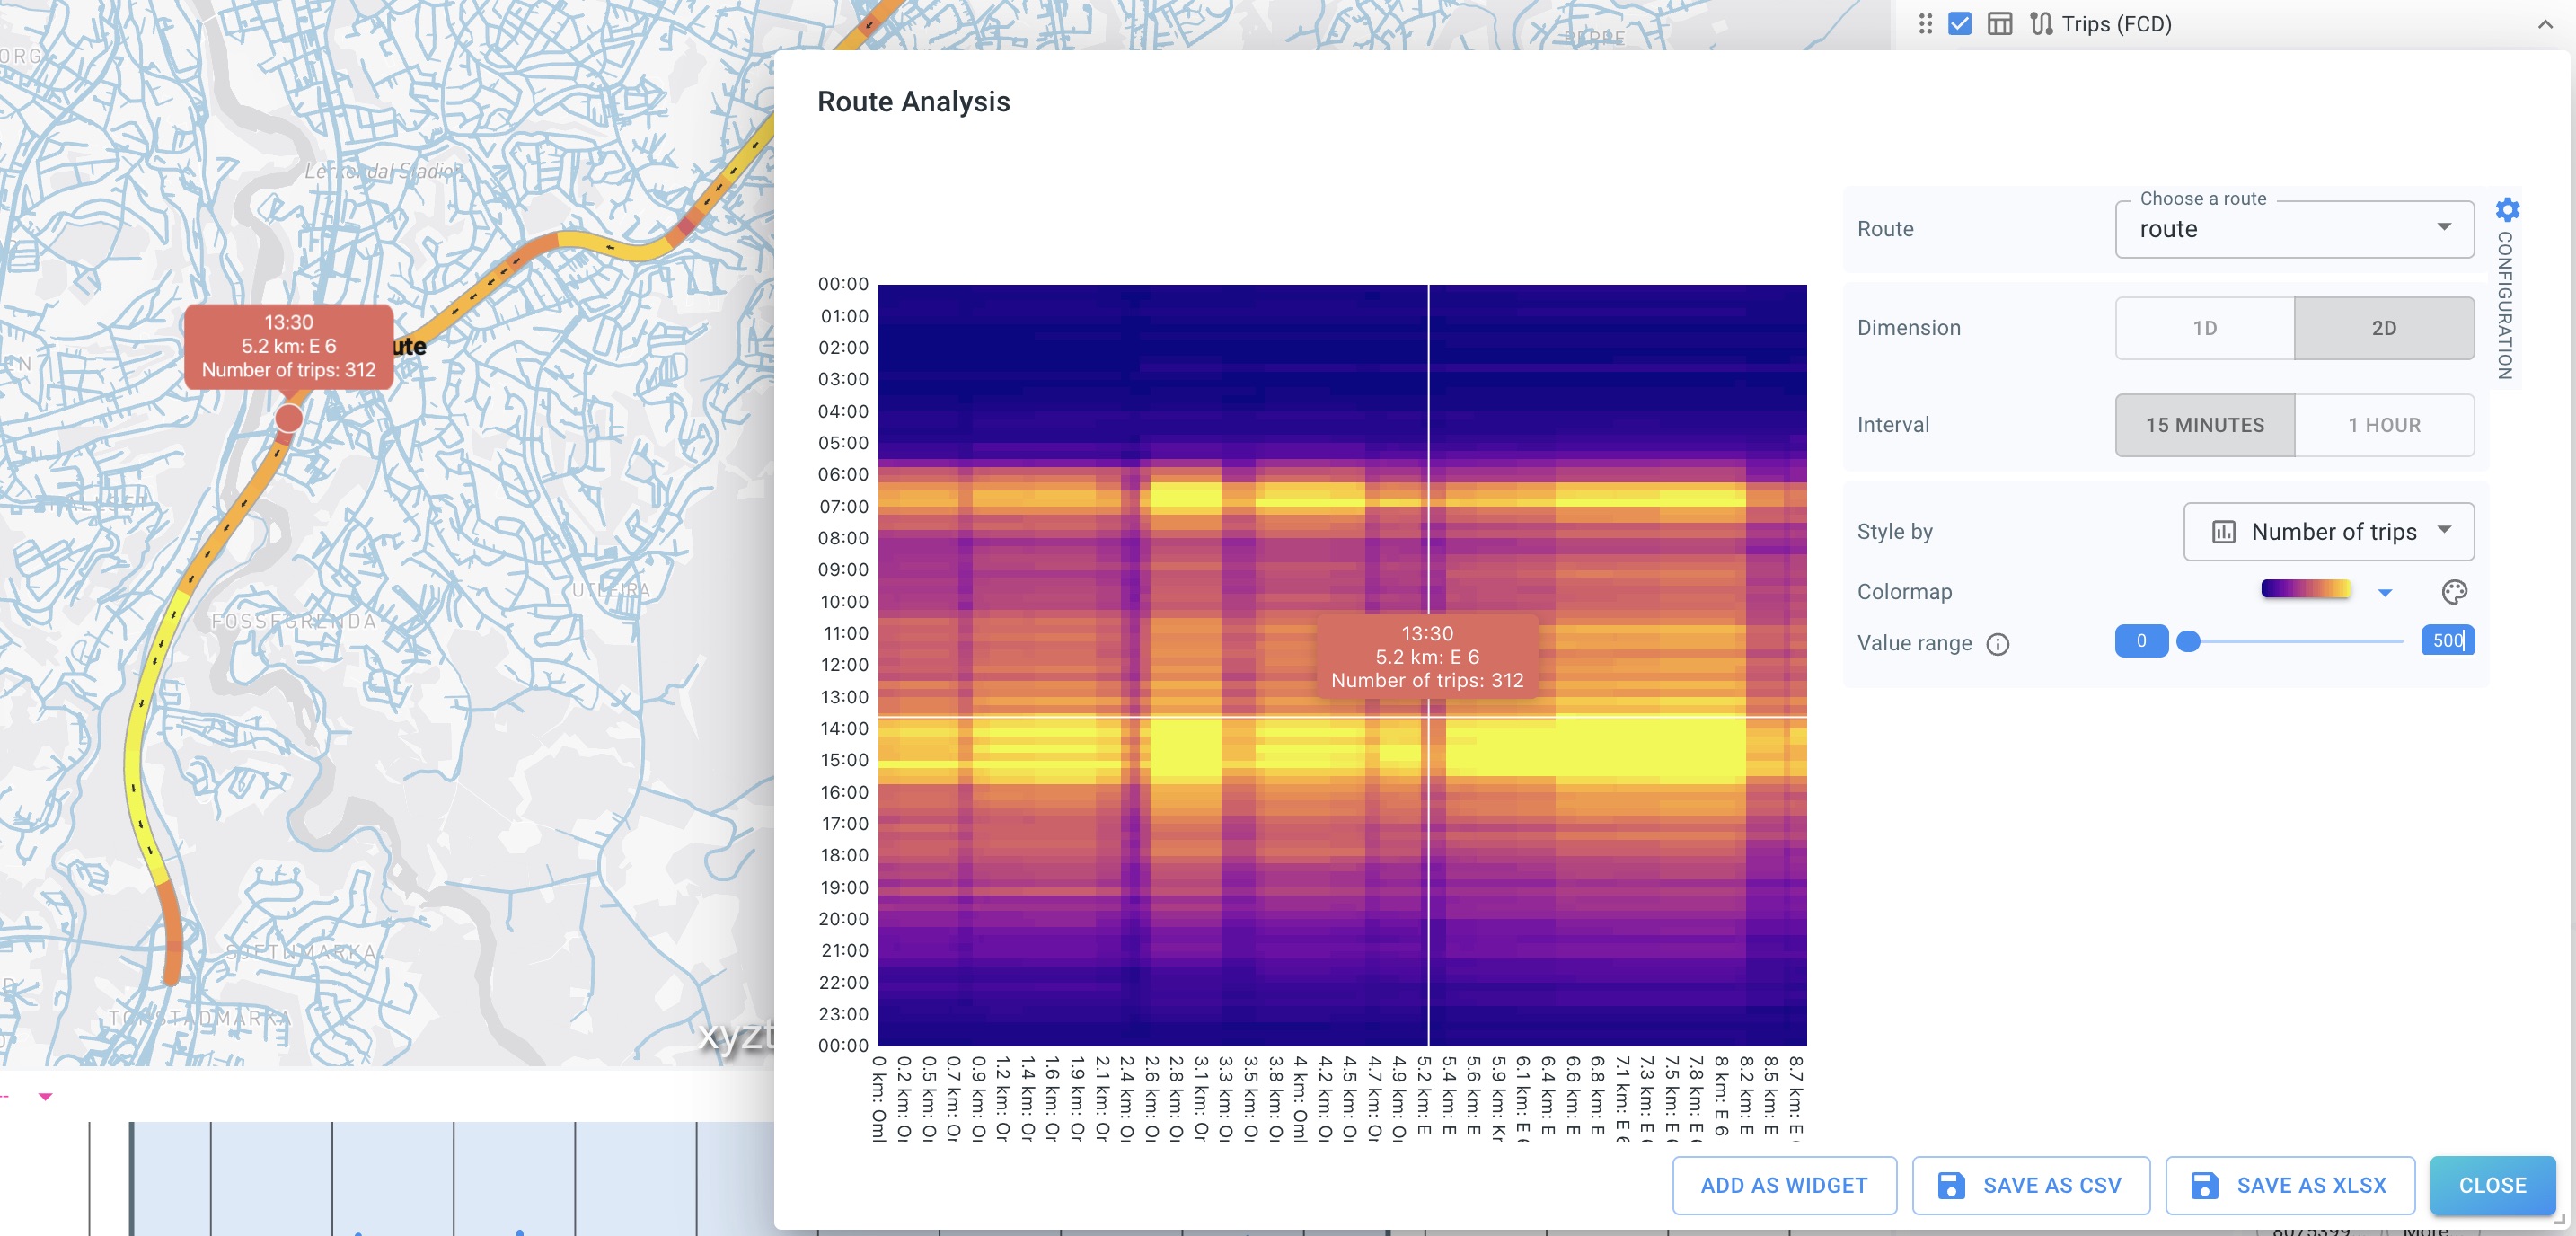
Analyze
Open the Route Analysis dialog, select a route, choose 1D or 2D analysis, pick an attribute to style by, and inspect/export results.
| A single saved route can be reused across projects and analyzed with different attributes (e.g. trips vs speed) without recreating the geometry. |
Got feedback? Additional questions? Just want to have a friendly chat?
Get in touch!