Got feedback? Additional questions? Just want to have a friendly chat?
Get in touch!
Styling your data
The colors that are shown on the spatial map are determined by a two-step process:
-
You indicate in the UI what value should be used to determine the color
-
Color by Number of assets or Number of records: the visual analytics page will count the number of records or assets, and use that numeric value to determine a color
-
Color by Occurrence: use a boolean value to determine whether the pixel should be colored. All pixels that are colored will use the same color.
-
Color by Attribute value: select the value of an attribute or property in your data, and use that value to determine the color
-
-
Map the value to a color:
-
When the value is numeric, this is done through a color map.
This color map can for example specify that all values between 3 and 5 should be red, values between 5 and 7 blue, … .
-
When the value is an enum or string, you also use a color map but one that maps strings onto colors (which we call a color palette).
The color palette can for example map "Fishing vessel" to green and "Oil tanker" to red
-
When the value is a boolean, it is mapped onto a fixed color.
-
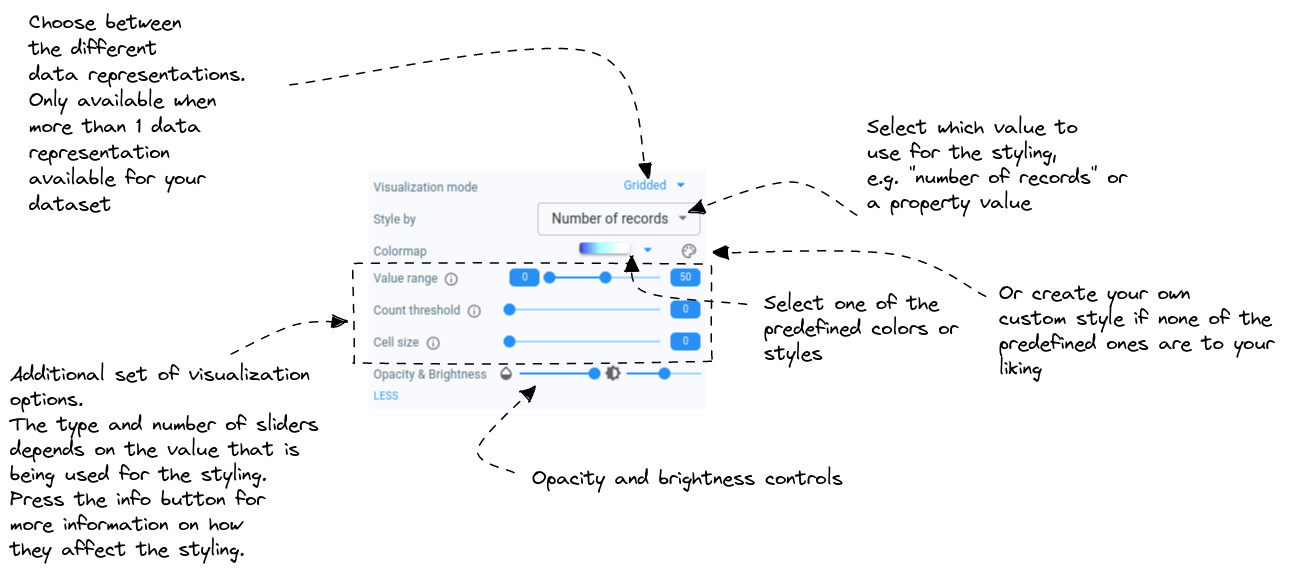
Overview of the UI to adjust the styling
All the UI elements to change the styling are contained in the Layers panel on the right hand side.
Figure 1. The UI elements to alter the styling
Numeric color maps
All the numeric color maps allow to:
-
Define a color map for a specific range
-
Define a fixed color to use when the value falls outside that range
-
Define a color to use when there is no value available for the chosen property.
For example when styling your data according to a speed property:
-
You can specify a color mapping for the speeds between 0 and 100 km/h
-
Specify a color for all speeds < 0 km/h
-
Specify another color for all speeds > 100 km/h
-
Specify the color to use when there is no speed information available
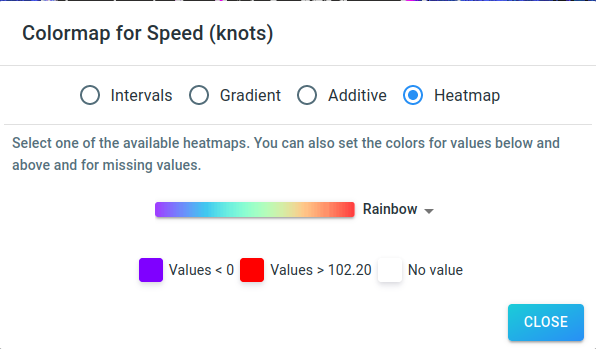
Figure 2. The customizer to adjust the numeric color map
The following options are available for the color maps:
-
Interval based color maps
-
Gradient color maps
-
Additive color maps
-
Heatmaps
Interval based color map
In an interval based color map, you specify numeric intervals and the corresponding color.
An example use-case for this type of color map is visualizing the speed of cars. Cars traveling on public roads have to adhere to the speed limits. For example in Belgium the speed limit for the majority of the roads is either 30, 50, 70, 90 or 120 km/h.
In this example, you could use the following intervals in your color map:
-
0-30 km/h
-
30-50 km/h
-
50-70 km/h
-
70-90 km/h
-
90-120 km/h
-
120+ km/h
When using such a color map and looking at an area where cars are only allowed to drive 50 km/h, you will easily spot the ones breaching the speed limit.
Gradient color map
In a gradient color map, you select the start and end color, and all other colors in the range will automatically get derived by interpolating between those 2 colors.
An example use-case for this is if you are not interested in the exact value, but rather want to get a feeling for where the low and high values are.
Additive color map
Very similar to a gradient color map, but instead of selecting a start and end color you only select the start color. That start color is then added up until reaching white.
For example:
-
Start color:
rgb(2,3,6) -
Next color:
rgb(4,6,12) -
Next color:
rgb(6,9,18) -
Next color:
rbg(8,12,24) -
…
Heatmap
These are some very specific color mappings that are well-known and widely used in visualization software.
Examples are the Jet and Hot color maps.
String color palettes
In a color palette, you define a mapping from a string value to a color.
For example:
-
When the value equals Oil Tanker, use green
-
When the value equals Fishing Vessel, use pink
-
…
For the string values that are not present in the mapping, you have the option to:
-
Use a fixed color
-
Use a random color
-
Color them transparent
You can also select the color in case there is no value for the property available.
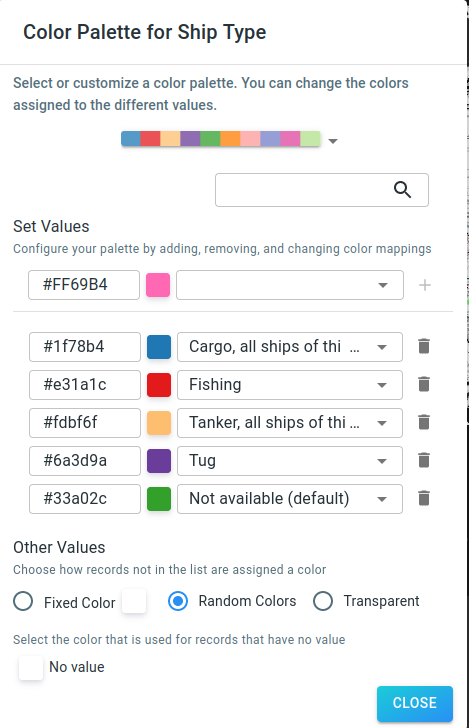
Figure 3. The customizer to adjust the color palette
Importing and exporting layer styles
Instead of having to manually apply the same style settings on (multiple) layers over and over, you can either:
-
Copy the style from one layer, and paste it onto the other layer
-
Export the style from one layer which saves it to a file. When you need to apply the same styling on another layer in the future, you can import that saved style file.
Note that this mechanism only works between layers which expose the same style settings, for example 2 Mapbox layers or 2 layers for the same dataset.
|
The exported layer styles are a match for the public REST API. They can be used in visual analytics related requests where you need to include style information for a layer. |
Got feedback? Additional questions? Just want to have a friendly chat?
Get in touch!