Introduction
Just like the spatial and the timeline view on the visual analytics page, the tabular view is another representation of the same data. In this case it shows the data with its properties into a table, and allows to download the data as CSV.
Opening the tabular view
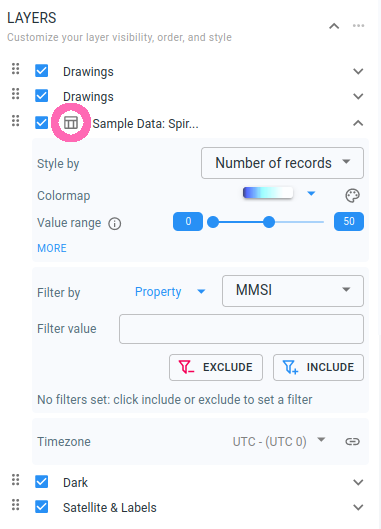
The tabular view for a specific layer of a map can be opened by pressing the button with the table icon in front of the layer name in the Layers panel.
After pressing the button, the tabular view for that map will open in a dialog:
What is shown in the UI
The data shown in the UI is the same filtered data as what is shown on the spatial map and the timeline. Any filters (spatial, temporal or on attributes) that you configured are applied on your original data, and only the records matching those filters are shown.
You can:
-
Sort the data by clicking on the column names. When the data is sorted on a column, a little arrow is shown next to the column name indicating the sort direction. Clicking the column name another time will toggle through the sorting options (ascending, descending, no sorting).
-
Configure which columns are shown: you can remove a column by clicking the
xsymbol in the blue chips. If you want to add a column, click the+symbol on the red chip. -
Search the data: if you enter a search term in the search field, the tabular view will only show the records that have a match for this search term.
-
Fit on the data: when working with time series data sets, the table view contains an extra column with a fit button. Pressing that button will close the table view and fit the spatial map on the area corresponding to that table row.
|
The tabular view only shows a limited number of records
The tabular view will show at most 10000 records. When more records match your filters, a warning message is shown informing you that only a subset of the records are shown. All operations (searching, sorting) only work on those 10000 records, and not on all the records matching your filters. |
Creating a tabular view widget on your dashboard
Using the Add as widget button, you create a widget for the tabular view on your dashboard.
The widget only shows the data, and inherits all the current settings of the tabular view.
-
The widget shows the same columns as you have configured in the tabular view
-
The columns are also sorted the same
-
If you entered a search term which filters down the data in the tabular view, this search term filter will be applied on data shown in the widget
-
The widget does not have buttons to scroll through the different "pages" of the table. It will only show a single page. The widget will show the same page as you were looking at when you created the widget, and the number of rows showing on the page will also be the same.
Downloading the data
The Download as CSV button allows you to download the data behind the tabular view.
This will always download all the rows, and not just the rows that are currently being show. The downloaded data will also include all the columns, even if you have configured the tabular view to only show a subset.
