|
This article only applies to movement data
This article is only relevant when working with movement data, not when working with time series data. You can read more about the differences between the two in this article. |
What is it?
Trajectories are consecutive sequences of location records that belong together. Think of them as space-time lines. An example is showing the trajectory of a ship by connecting all the recorded positions, sorted by their timestamp, with a line.
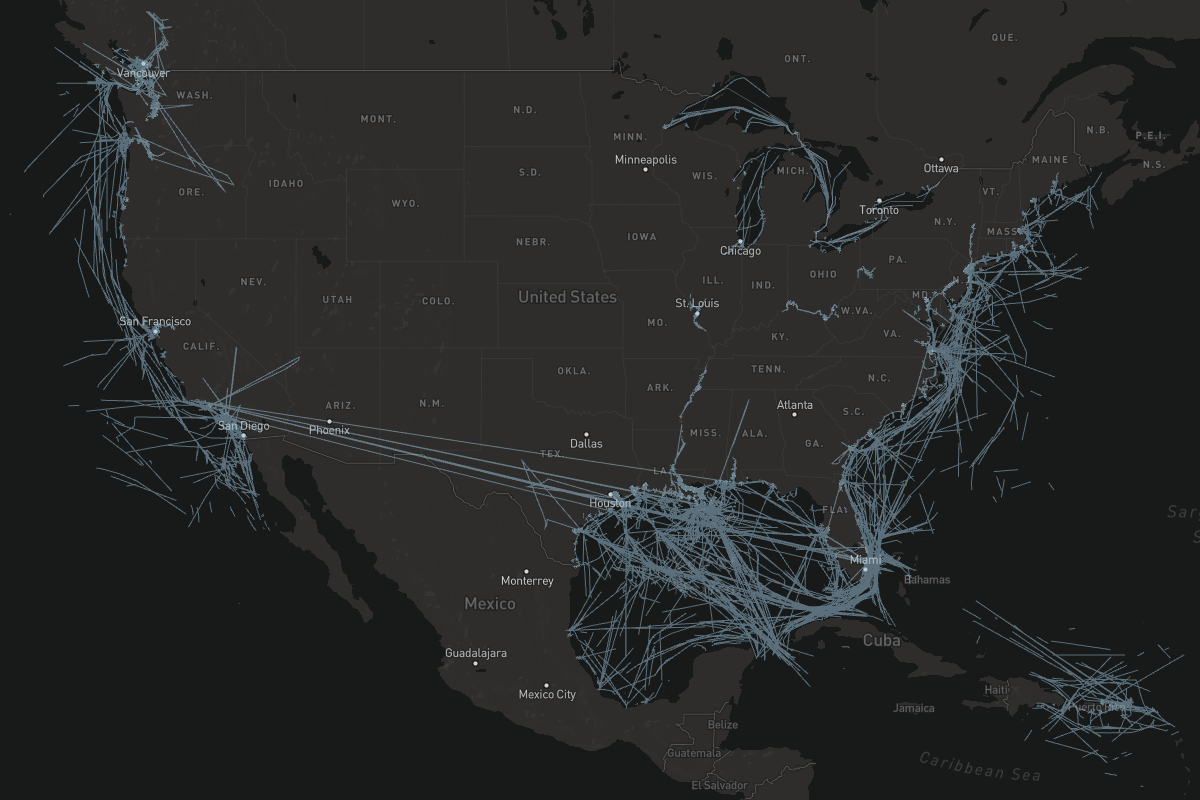
There might be cases where you don’t want two successive records to be connected, for example, when a ship’s transponder is turned off for a long time. Connecting such points on a map can result in long crisscross lines that may clutter the map and make it hard to analyze data.
You can use the distance and duration threshold settings to control the connectivity between successive points:
-
Distance threshold: two successive records are only connected if their distance is less than the configured distance threshold.
-
Duration threshold: two successive records are only connected if the time between their recordings is less than the configured duration threshold.
Records will only be connected if they meet both the distance and duration threshold requirement.
How to configure it ?
When you are creating or editing a data set, click the Configure Processing Settings button:
On this page, you can fill in the distance and duration thresholds.
-
The distance threshold is expressed in meters
-
The duration threshold is expressed in seconds
Determining a good distance and duration threshold
Tracking devices often have a fixed sampling interval; this sampling, increased with a small error margin, gives a good start point for the duration threshold. You can then derive a distance threshold by multiplying the duration threshold by the maximum speed of the tracked objects.
For example, if your dataset contains traffic data, cars are driving at a maximum speed of 120 km/h, and the sampling interval is 1 minute, the following would be good settings (we use a 1.1 error margin):
-
Duration threshold: 1 minute * 1.1 = 66 seconds
-
Distance threshold: 120 km/h * 1/60 h * 1.1 = 2200 meter
Interpreting the results
If your processed data doesn’t look as expected, the following guidelines may help you tweaking the distance and duration thresholds:
-
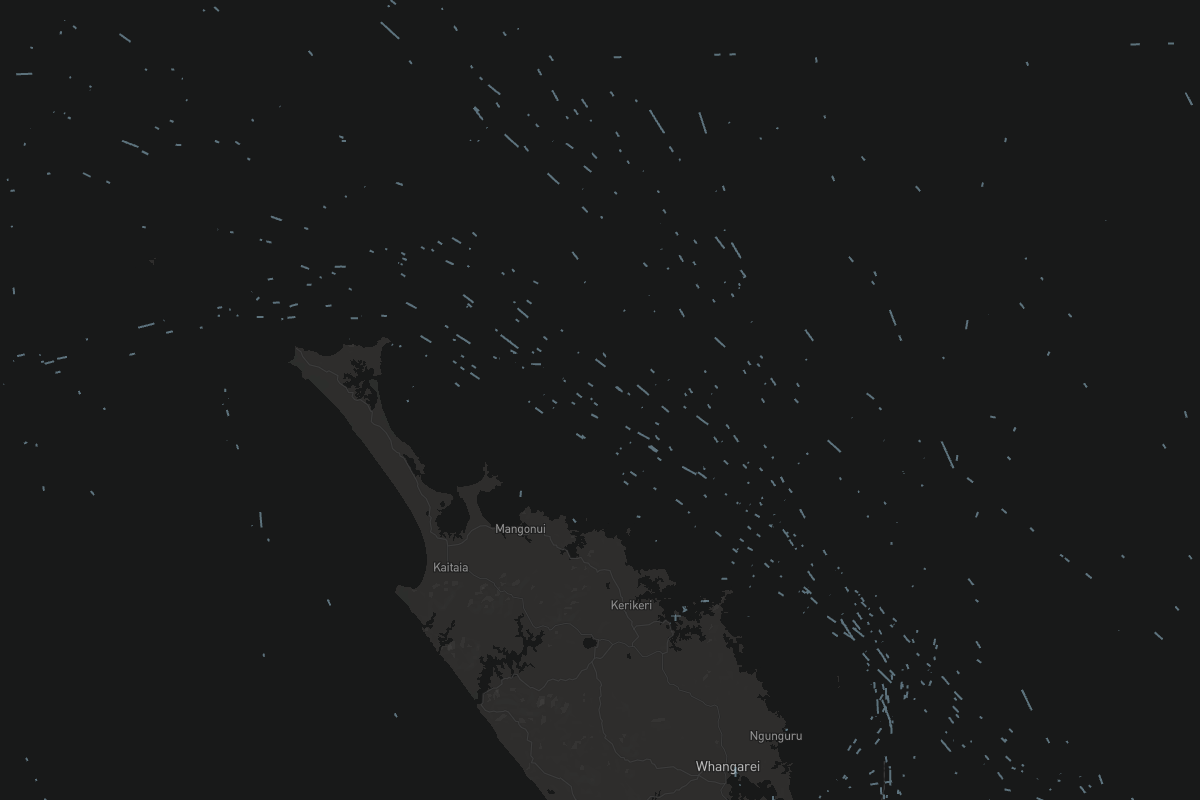
If you see many small, disconnected line segments with gaps between them in the processed data, this could be an indication that you need to increase either the distance or duration threshold (or both).
-
If your map is cluttered with many long crisscross lines, or there are (long) lines in areas where you wouldn’t expect them, this could be an indication that you need to decrease either the distance or duration threshold (or both).
|
You can always adjust the resolution
even when data has already been processed. The only caveat is that adjusting these settings requires the data set to be processed again. This takes some time. |
Performance tips
For scalability purposes, trajectory data are divided into rectangular tiles. The dimensions of these tiles are automatically derived from the distance threshold during processing.
If, for example, your dataset contains maritime data across the world with long sampling intervals (and thus a large distance threshold), the trajectories will be stored into relatively large tiles. On the other hand, if for example, your data contains indoor forklift data, the distance threshold will be small and the tile size will be adapted accordingly.
If you choose an inappropriate distance threshold for your dataset, this could result in suboptimal tile sizes and impact the performance of the platform:
-
If your dataset takes a very long time to process, this could indicate that your distance threshold is too small, resulting in (too) many small tiles. Try increasing the distance threshold.
-
If your data takes a long time to load in the browser, this could indicate that your distance threshold is too large, resulting in (too) large, heavy tiles. Try decreasing the distance threshold.


