Got feedback? Additional questions? Just want to have a friendly chat?
Get in touch!
What is shown on the distribution analytics page
The distribution analytics page displays statistics on how the values of the properties in your data are distributed over a certain time period and area. This is the same information as what is shown on the distribution panel on the visual analytics page.
|
Distribution analytics = segmentation analytics
Distribution analysis is also called segmentation or segment analytics. |
However, compared to the visual analytics distribution panel, the distribution analytics page:
-
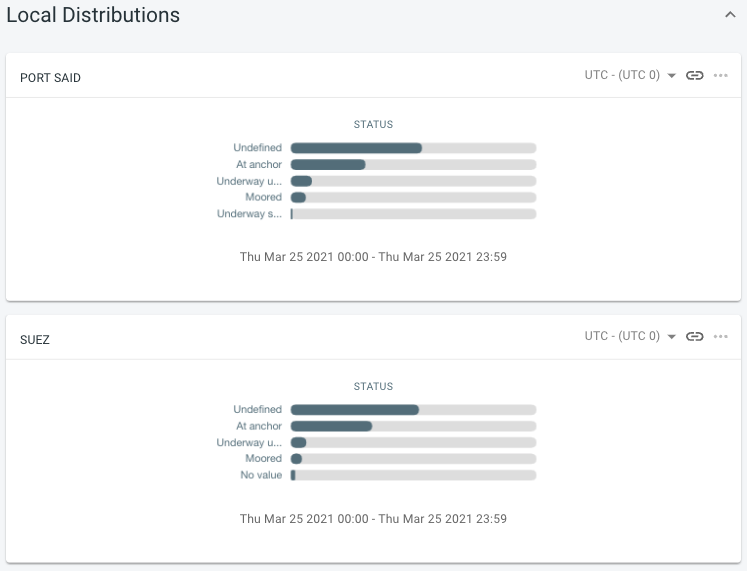
Makes it easy to compare the distribution of a property in different regions against each other
Figure 1. Comparing the distribution of a property in Port Elizabeth versus Port Said -
Makes it easy to compare two time periods against each other, and spotting the difference
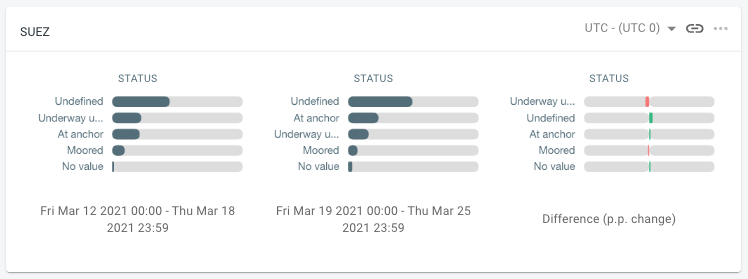 Figure 2. Comparing the distribution of a property during two different time periods
Example use-cases for the distribution analytics page include
-
Looking at the speed profile on different sections of the highway.
-
Analyzing the different age groups that visit a store versus a store of the competition.
-
Analyzing the impact on maritime traffic in terminal A after closing terminal B.
Got feedback? Additional questions? Just want to have a friendly chat?
Get in touch!