Got feedback? Additional questions? Just want to have a friendly chat?
Get in touch!
What is visual analytics ?
The visual analytics page allows you to explore your data interactively
-
In space, and
-
In time
and see how the properties in your data are distributed in that location and time period.
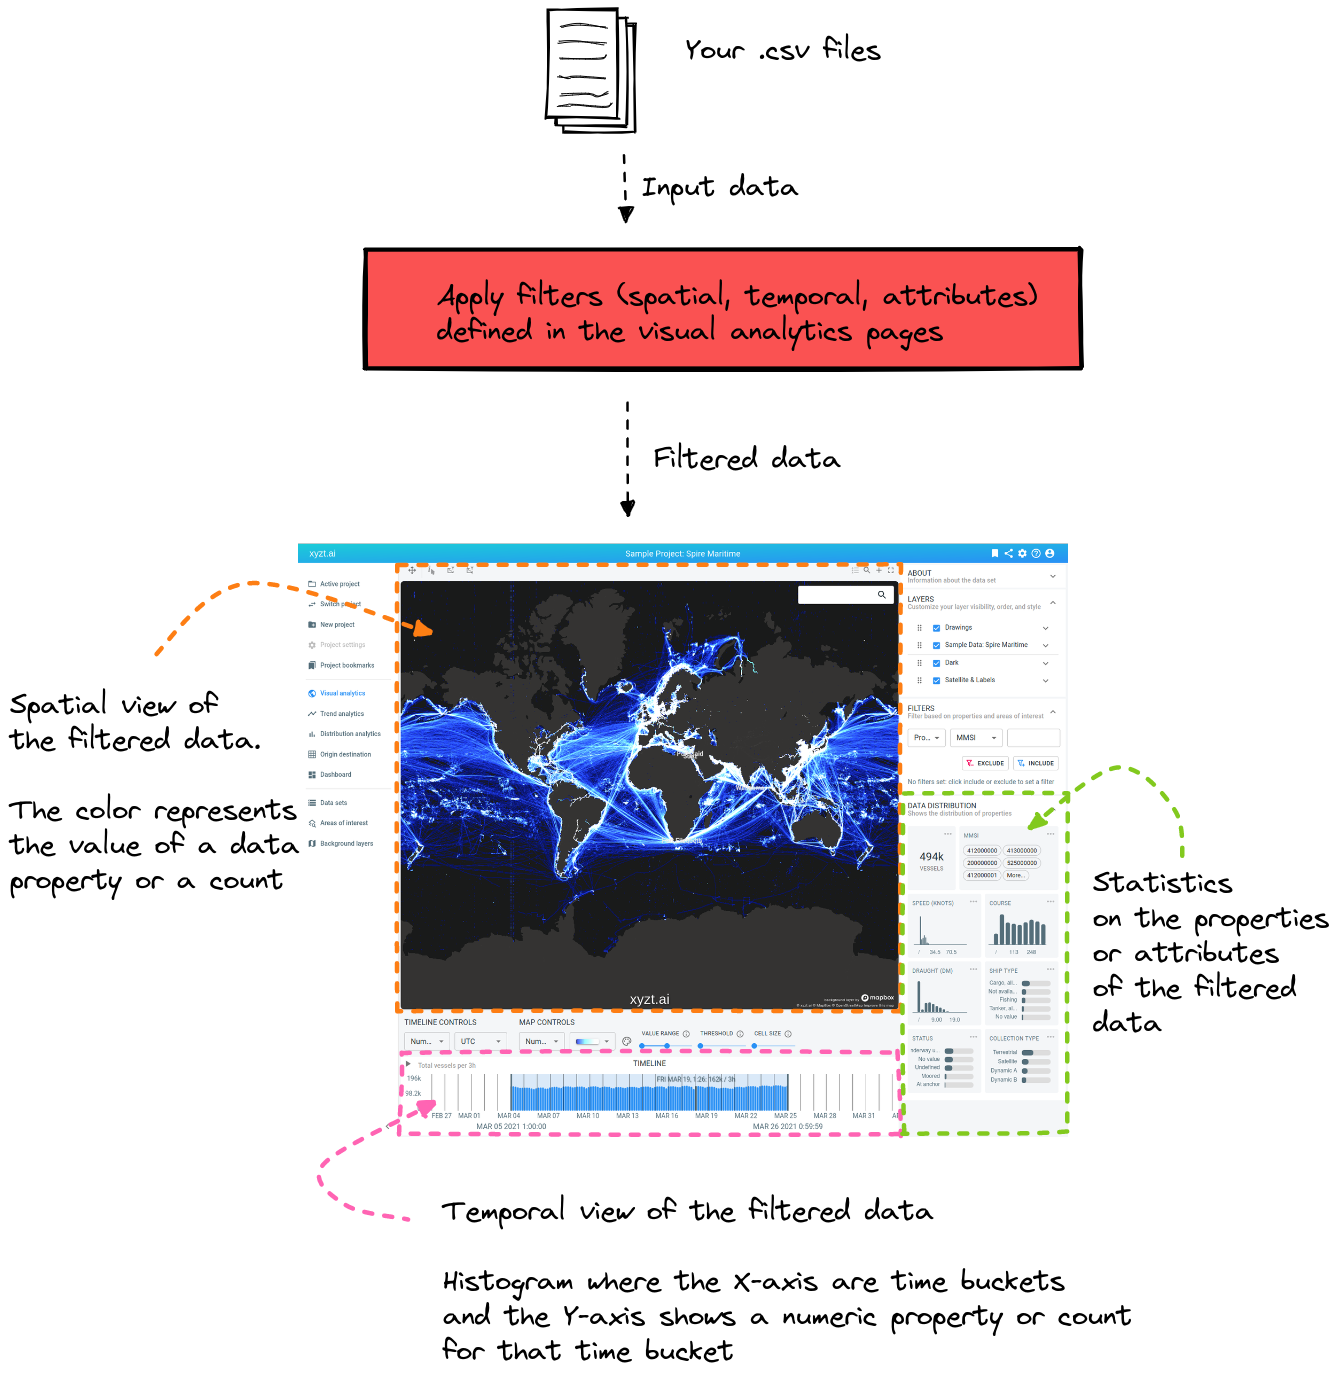
It allows defining and updating filters and provides you with 3 different views on that filtered data:
Figure 1. The 3 different views of the visual analytics page
-
Spatial map: the spatial maps shows 2 things at the same time:
-
The location of your data
-
The value of a data property (e.g. the speed of a car), or a count (e.g. the number of cars at that location)
-
-
Temporal view: the temporal view is a histogram, visualizing 2 things at the same time
-
The X-axis shows how the data is spread in time
-
The Y-axis shows the average value for a data property (e.g. the average speed of the cars in that time bucket), or a count (total number of cars in that time bucket)
-
-
Statistics on the data properties: here you see how the properties or attributes in your data are distributed
|
Each of these views shows the same filtered data
The most important thing to remember is that each of these views shows the same filtered data. For example when there is a filter defined to only show data located in the USA:
|
Apart from the filtering and visually explore your data, the visual analytics page also
-
Allows to change the styling of your data. This makes it easier to visually extract information from the displayed data.
-
Allows to export data to
.csvfiles or onto a dashboard. -
Allows to share your analysis with team members and even with external people, or embedding it on another website.
-
Easily compare 2 sets of filters by having 2 spatial maps, 2 timelines and 2 data distribution panels side-by-side.
The remainder of this article will discuss each of these features in a bit more detail, as well as provide additional links.
Filtering
The visual analytics page works with a filter which ensures that only the data that passes the filter will be displayed on each of the 3 views.
This filter consists out of 3 parts: a spatial filter, a temporal filter and an attributes filter.
Spatial filter
The spatial filter filters on the location of the records.
There are basic filters (for example only show the data in a specific region) as well as more advanced filters (for example only show the vessels/cars/… that pass through a certain region).
You can of course combine multiple spatial filters, for example only show the data contains in either region A or region B.
All details on how to create and edit these spatial filters are discussed in this article.
Temporal filter
The temporal filter filters on the timestamp of the records.
There are basic filters (for example only show the data between time A and time B) as well as more advanced filters (for example only show the records on Mondays and Tuesdays between 08:00 and 10:00AM).
Just like spatial filters, time filters can be combined.
All details on how to create and edit these time filters are discussed in this article.
Attribute or properties filter
The attribute filter filters on the properties of the records. For example only show vessels with a length between 20 and 40 meters or only show cars of the brand Audi.
These filters can be combined as well.
All details on how to create and edit these attribute filters are discussed in this article.
Styling
You can change the way the data is visualized on the spatial map. By adjusting and tweaking the colors, you will make it easier to find what you are looking for in your data.
All details on how to configure the styling are described in this article.
Basic styling
Basic styling allows you to choose from a number of predefined colors and gradients that are applied on all visualized records. This is mainly used when you are not interested in particular values, but rather want to get a good feel for your data.
An example is using one of the pre-defined heatmaps when you are displaying the number of vessels or cars at each location.
Advanced styling, based on the data properties
With advanced styling, you can let the color depend on the actual value of a property.
For example, you could decide to:
-
Draw all cars traveling at a speed < 50km/h in green
-
The ones doing 50-70km/h in orange
-
The ones doing over 70km/h in red
or for string-like properties:
-
Draw all vessels of type "Fishing boat" in blue
-
Draw all vessels of type "Oil tanker" in brown
-
Draw all vessels of type "Cargo" in pink
Exporting
When you have configured your filter and styling and came to some interesting conclusions, you can export this information in two ways:
-
The data behind the data distributions/statistics can be downloaded as
.csvfile by right-clicking on them -
You can create widgets from the spatial map, timeline or property distributions and add those widgets to a dashboard. This is also done by right-clicking on one of those.
Saving and Sharing
You can also save your analysis (including all the filters and styling you have configured) to go back to it at a later moment in time. This is done by creating a bookmark for it. Each time a bookmark is loaded, it will restore all these settings.
These bookmarks are available for each team member, making it easy to share different analysis between colleagues.
There is also an option to share it with people who don’t have access to the platform. When you create a link for a bookmark, everybody with access to that link can visit the visual analytics page and will see your data.
Once a link is created, it’s even possible to embed the visual analytics page into another webpage. This allows for example to show an interactive visual analytics page on your company page.
Side-by-side view
There is an option to create a second set of views, so that you have:
-
2 spatial maps
-
2 timeline views
-
2 data distributions
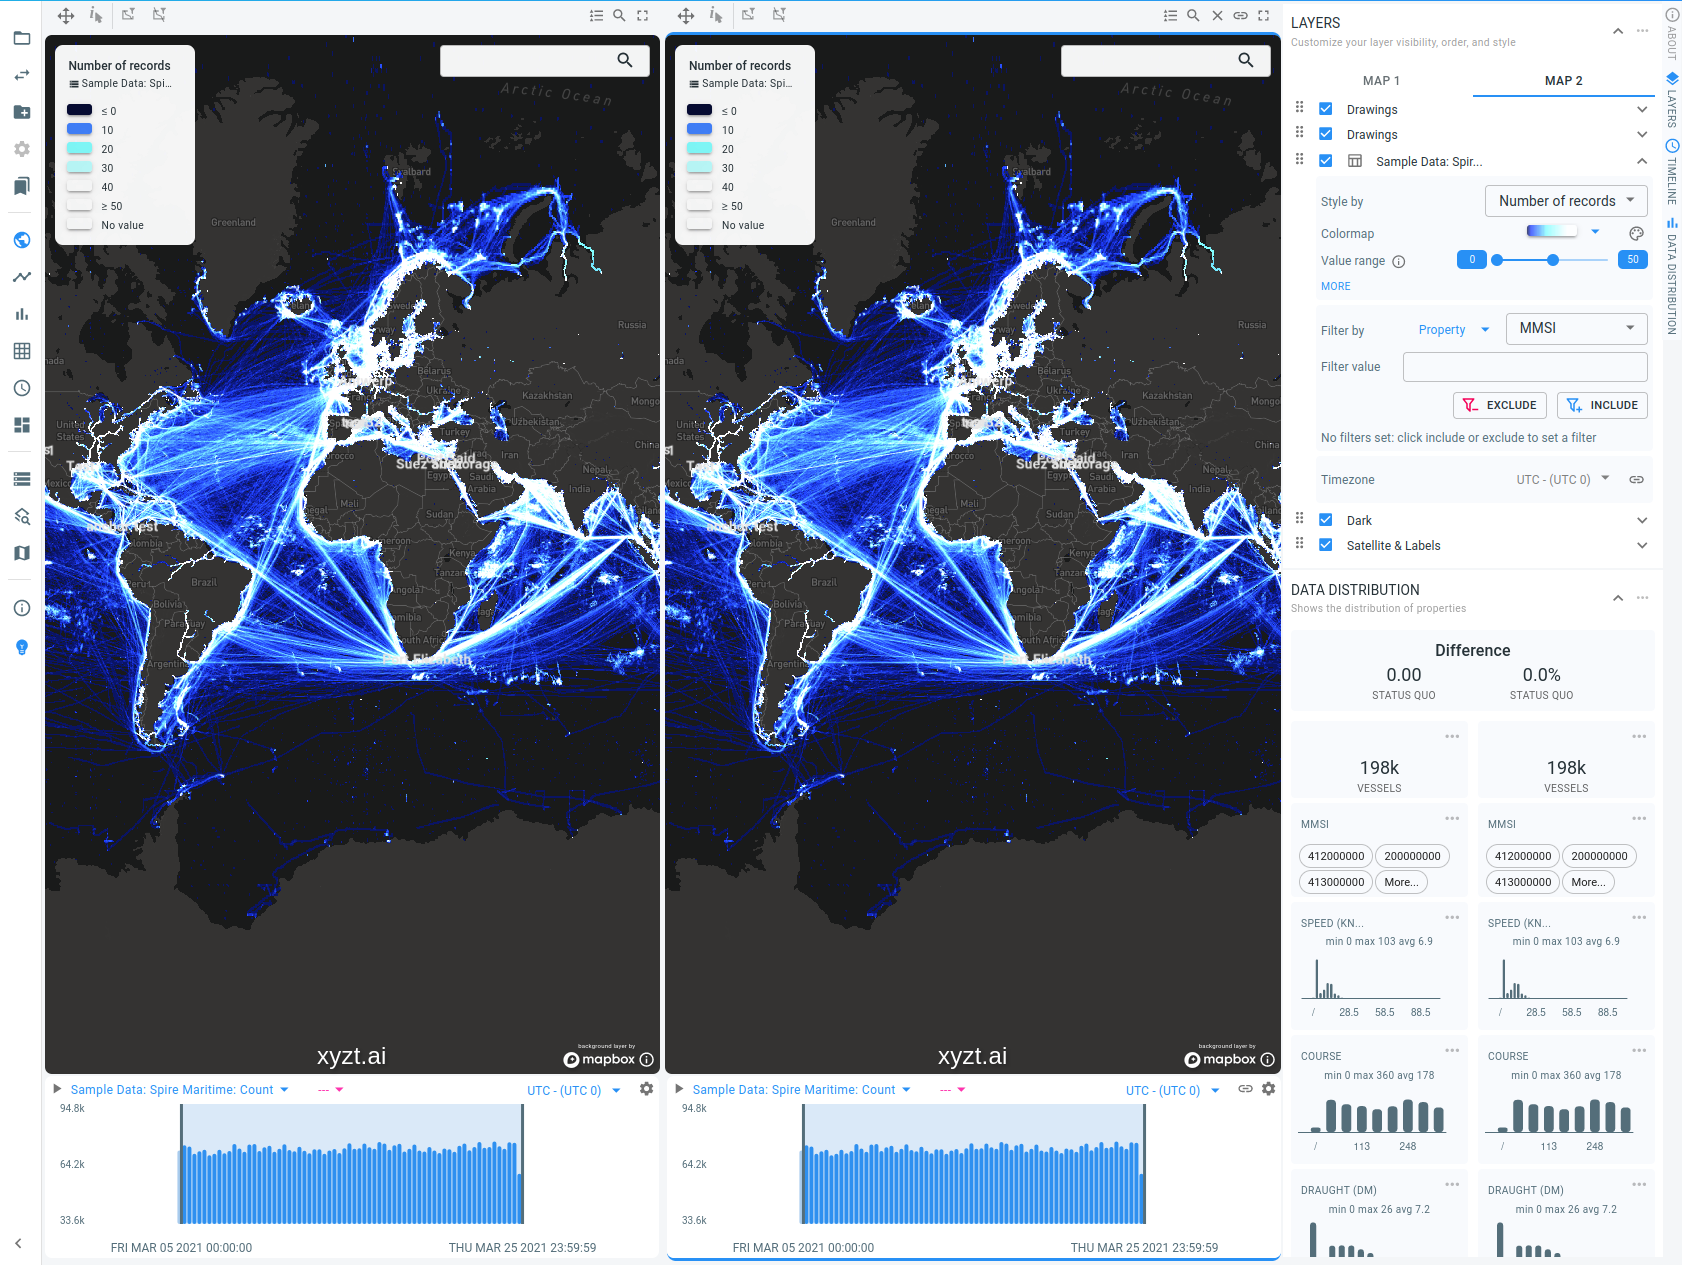
Figure 2. The visual analytics page with 2 sets of views
Each set of views has:
-
Its own styling
-
Its own filter
This side-by-side view makes it easy to compare things.
For example, you could compare car traffic on week days with weekends by configuring a different time filter for each view.
See this article for more details.
Got feedback? Additional questions? Just want to have a friendly chat?
Get in touch!