Got feedback? Additional questions? Just want to have a friendly chat?
Get in touch!
Performing visual comparisons
You can visually compare two sets of your data in different ways:
-
Compare in the same region, but different time interval (learn about configuring different time interval in this section)
An example use case is to analyze the impact of a change in the environment on the assets your tracking.
-
Compare in the same region, but with different attribute filters
An example can be comparing two populations in your data, e.g., young people versus older people.
-
Compare in different regions, with the same or different time interval (learn about configuring different time interval in this section)
An example use case can be comparing the business in two different stores or two different areas of an event
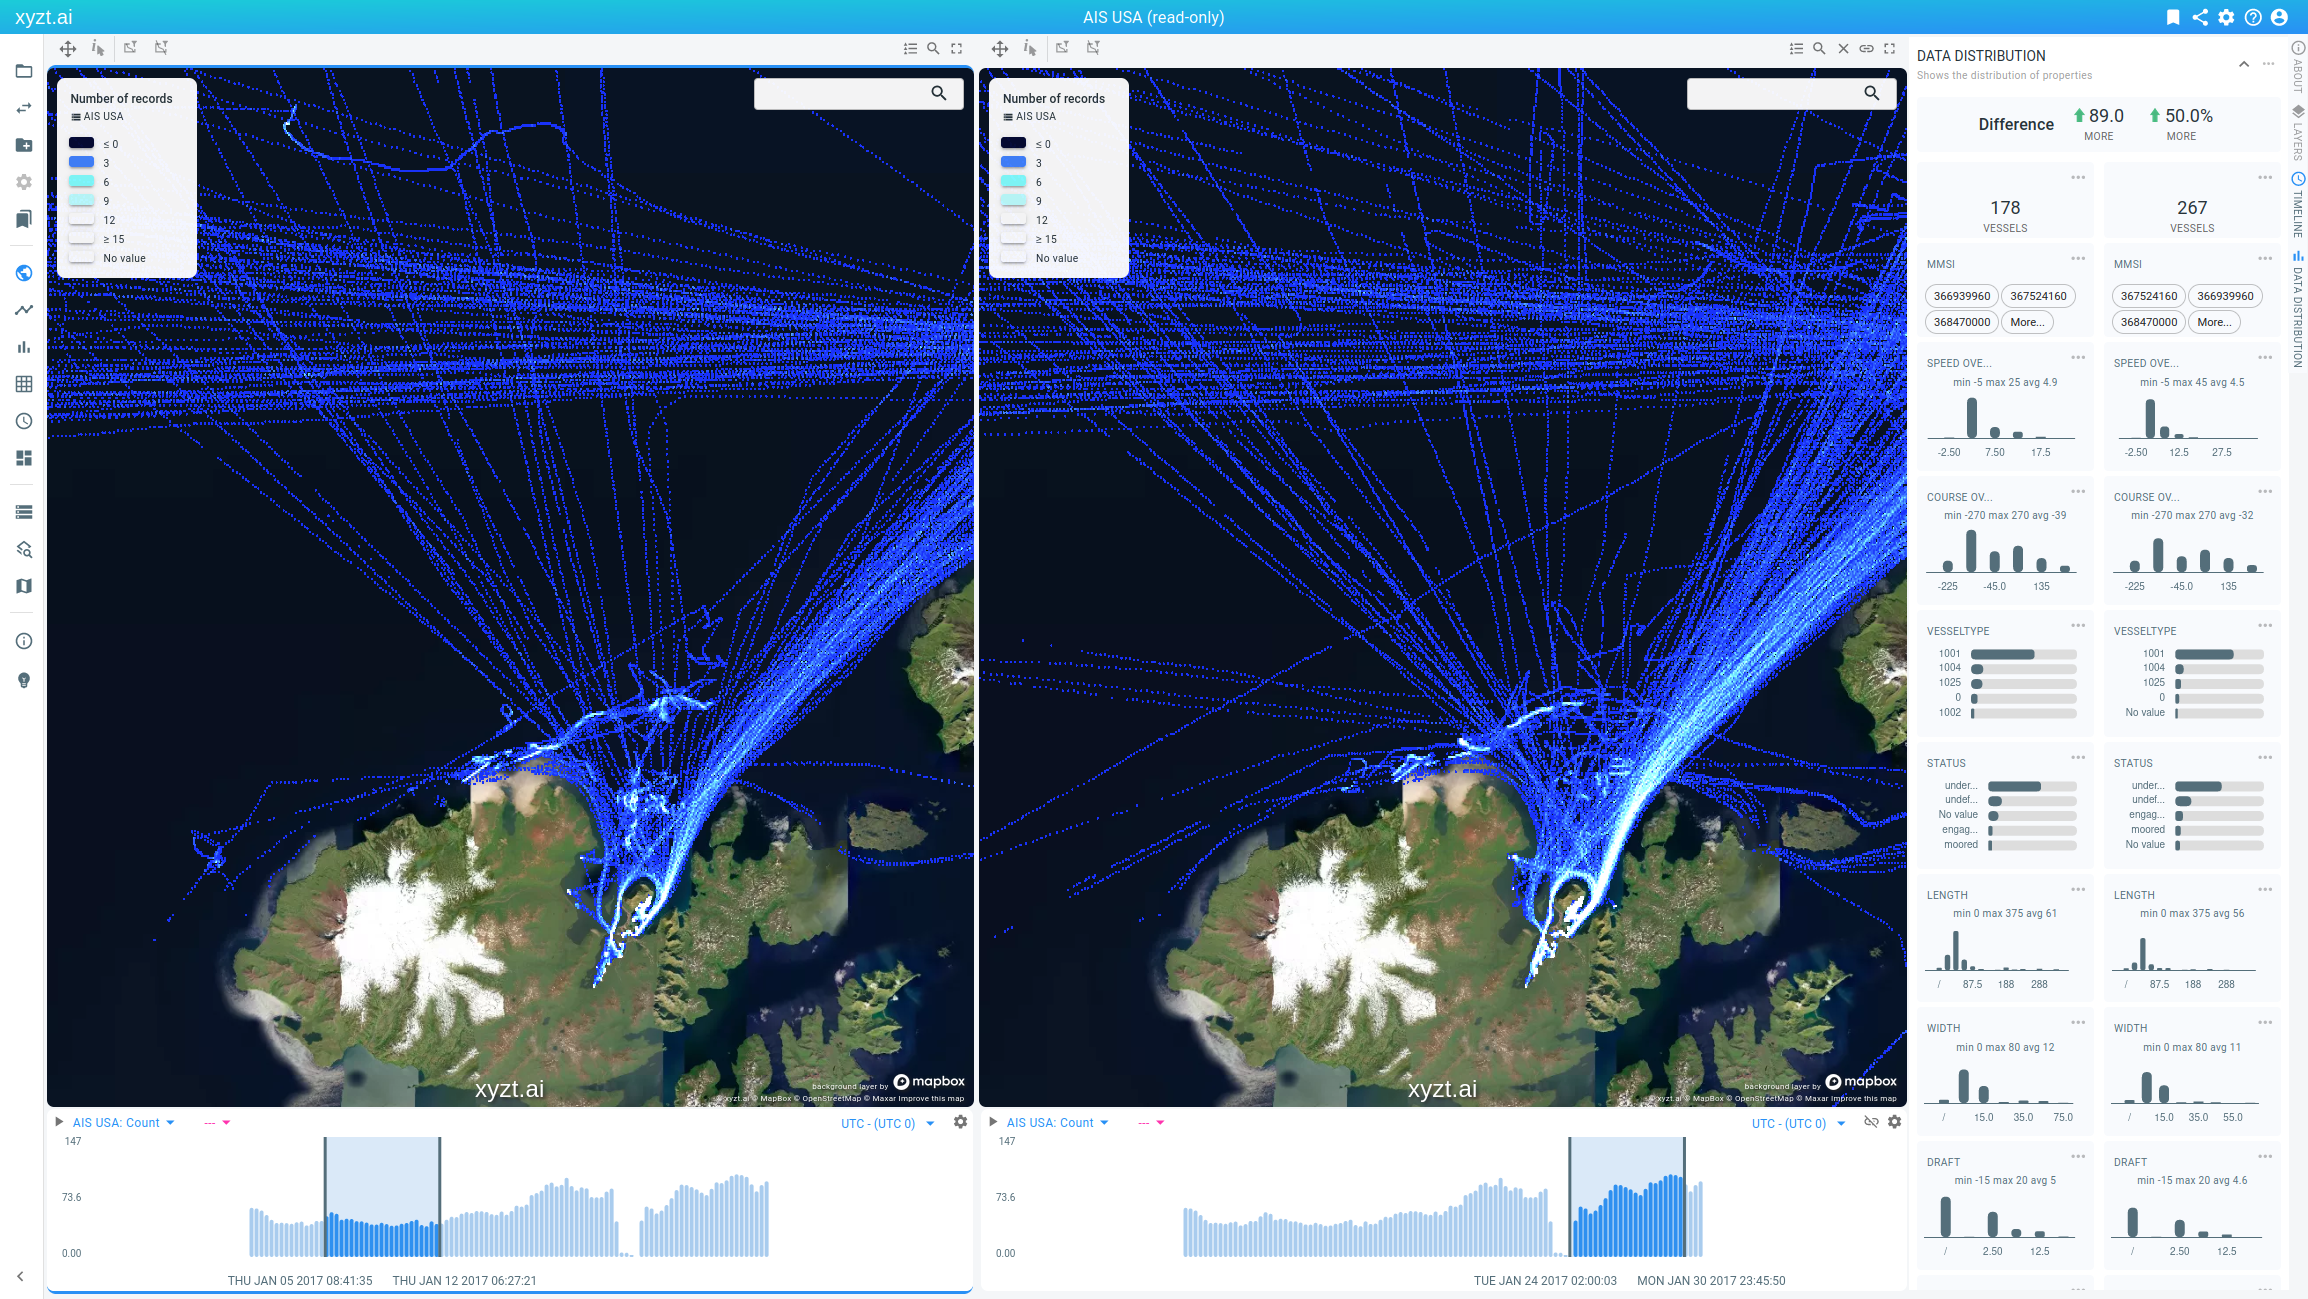
Figure 1. Comparing the same area over two different time periods
A visual comparison like the above starts by splitting the map and timeline in two, by clicking on the ‘+’ button in the upper right corner of the map.

Figure 2. Button in the right top corner of the spatial map to create an additional map
It can be ended by clicking the ‘x’ button in the top right corner of the second map.
Note that also the timeline is split, as well as the data distribution panel.
The two maps and timelines are by default linked so that the two maps/timelines move in sync when panning or zooming.
Maps (timelines) can be de-linked by clicking on the link button (![]() ) in the top right corner of the second map (timeline).
) in the top right corner of the second map (timeline).

Figure 3. Button in the right top corner of the spatial map to de-link the two maps
Note that splitting the map, but keeping the maps and timelines linked, has a separate possible use-case in visually analyzing your data while styling it in multiple ways:
-
Style the data on the left map for example by a data property ‘Status’.
-
Style the data on the right map for example by a data property ‘VesselType’.
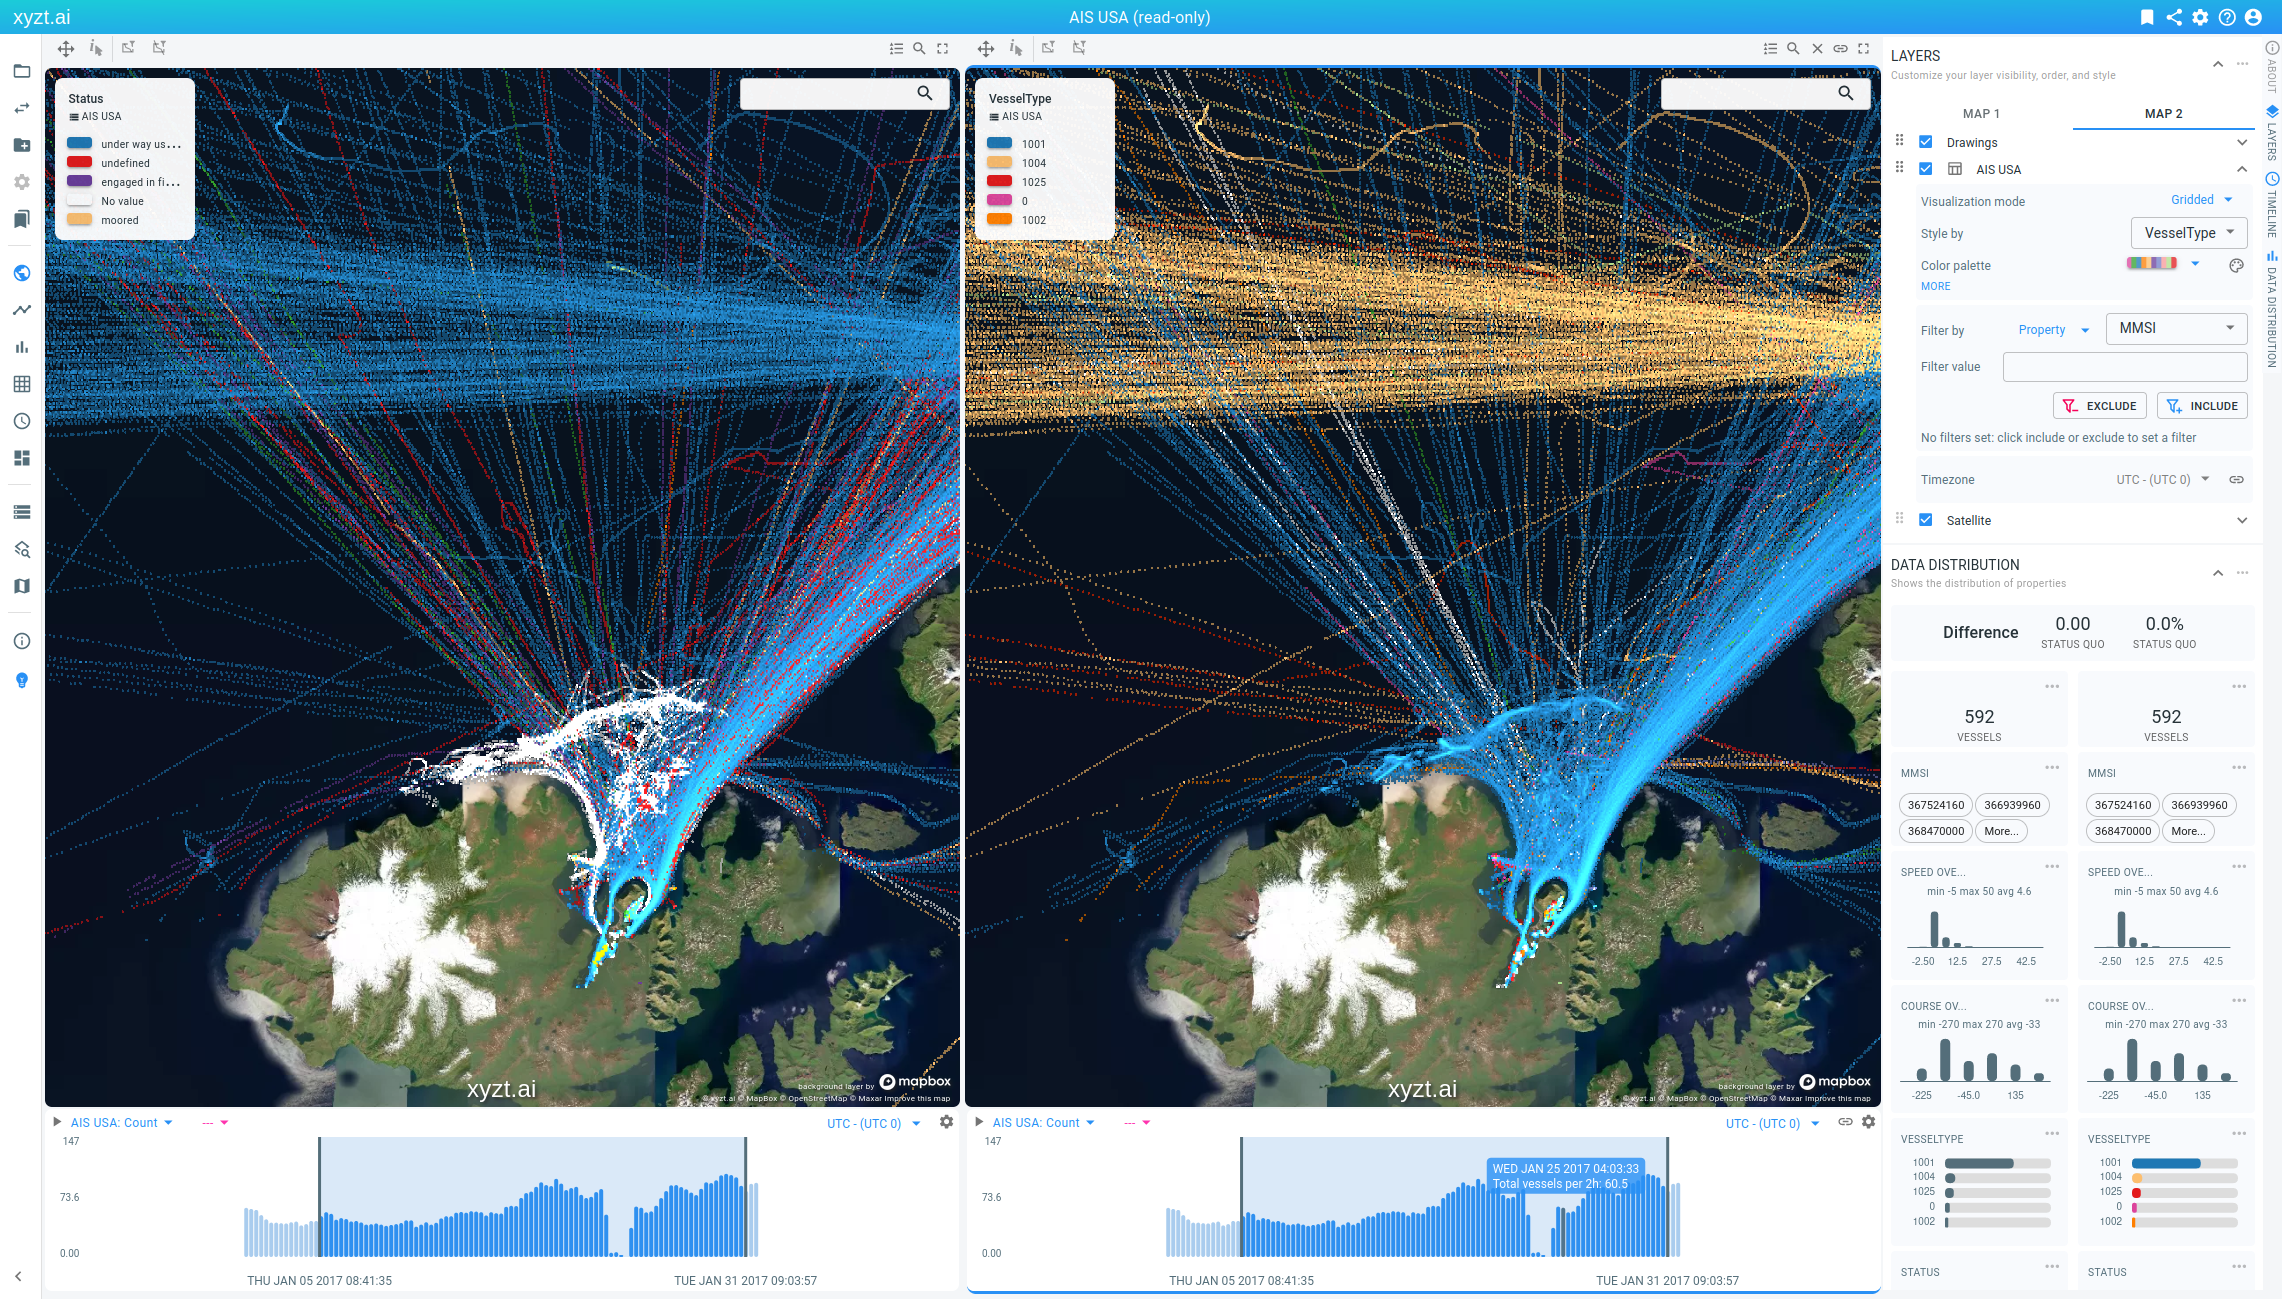
Figure 4. Styling the same data in multiple ways to ease visual analysis
|
Select the map to style or filter before making changes
You can select the map to style or filter by clicking on the map or by clicking on the map selector in the Layers panel: 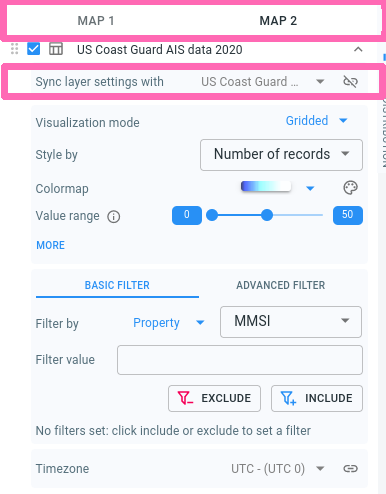
Figure 5. The button in the Layers panel to select the map from which the layers and their style/filter settings are shown, as well the option to sync the layer settings
The panel also has the option to sync the layer settings across maps or compatible layers. Activating this applies the style and filter settings on both layers at the same time. |
Got feedback? Additional questions? Just want to have a friendly chat?
Get in touch!