|
This article only addresses the basic filtering options
This article only addresses the basic filtering options that are available in the UI. You can also create more advanced filters through a query language, which is explained here. |
This article describes how you can apply attribute- or property-based filters on your data.
It’s strongly recommended to first read the introduction article which explains how the visual analytics page uses these filters.
You can apply filters on each of the properties that you have marked as included for analysis when you created the data set.
For numeric properties, you can the range of values that should be included or excluded
For enum and string properties, you can include or exclude certain values
The attribute filters are combined as follows:
Different values for the same property are combined with OR, e.g., when “Status=engaged in fishing” and “Status=underway using engine” are set as inclusive filters, all records with a status of either of two are shown.
Different filters for different properties are combined with AND, e.g., when “Status=engaged in fishing” and “Cargo: [10,100]” will show only the records engaged in fishing and with cargo at least 10 and at most 100.
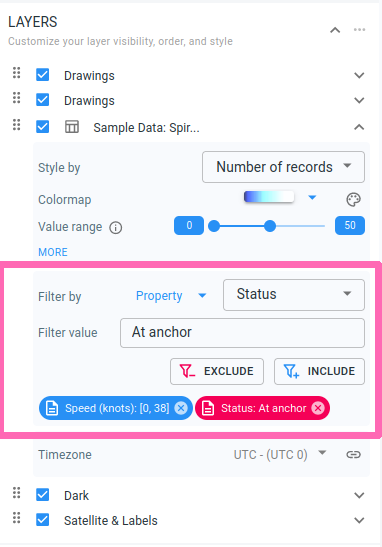
You create attribute filters in the Filters section of the Layers panel on the right-hand side of the visual analytics page.
In the first drop-down, select Property
In the second drop-down, select the property on which you want to filter
Depending on the type of property, you
select the range in case of a numeric property
select the accepted value in case of an enum or string property
Press the INCLUDE button if you want to only include records that match this filter. Press the EXCLUDE button if you want to exclude records that match this filter.
The filter will be added to the list of filters at the bottom of the panel, and the color indicates whether the data matching the filter is included (=blue) or excluded (=red). You can remove the filter afterwards by clicking on the cross icon of the filter.