Got feedback? Additional questions? Just want to have a friendly chat?
Get in touch!
What are areas of interest
Areas of interest define spatial areas which:
-
Are shown on the spatial map on the Visual Analytics page
-
Can be used as spatial filter while doing analytics
-
Can be used as area to compute statistics
|
Not sure whether you are looking for an area of interest layer ?
See the Introduction to data management article for an overview of the different types of data resources you can use in a project. |
How to create a new area of interest layer
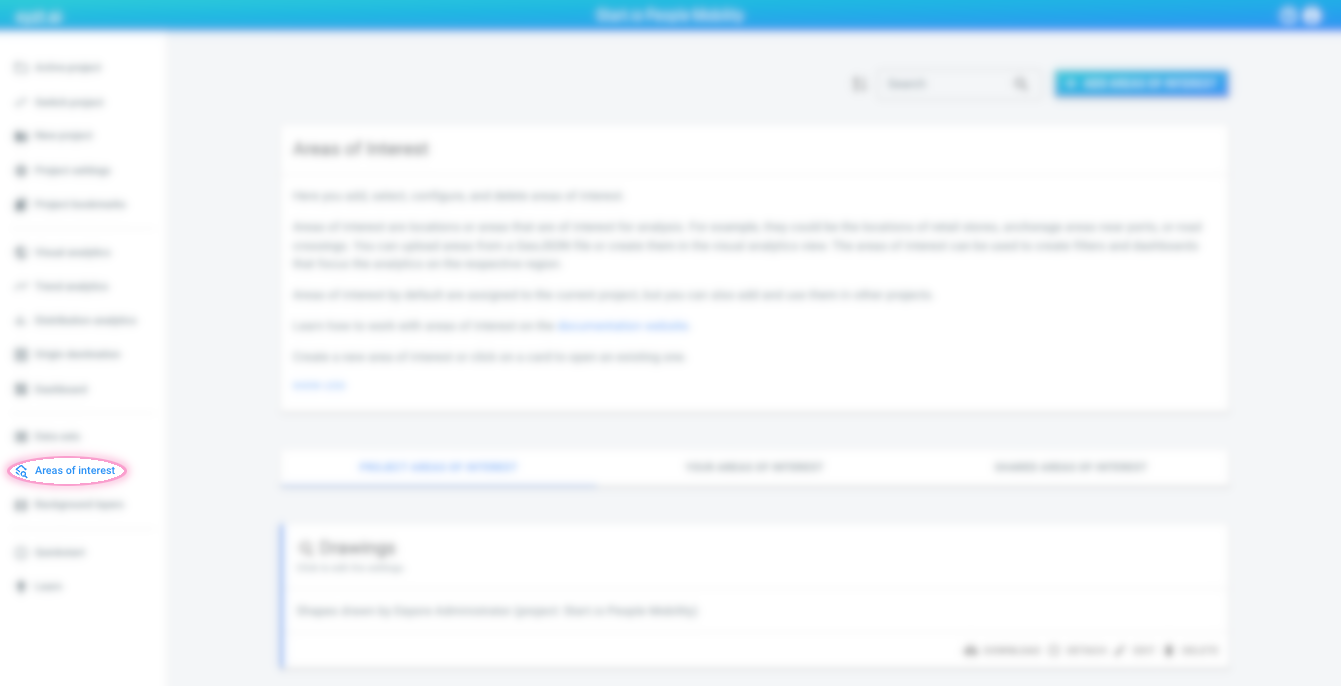
Step 1: Navigate to the 'New area of interest' page
by first clicking on the Areas of interest button in the left navigation bar
Figure 1. The Areas of interest button in the navigation bar
and then on the Add areas of interest button in the top right corner of the Areas of interest page.
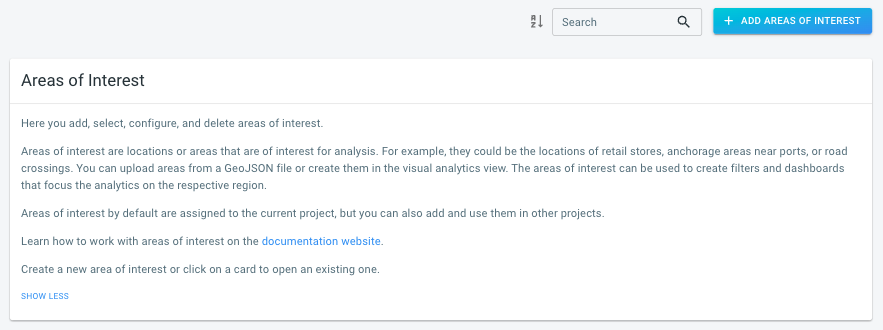
Figure 2. The Add areas of interest button in the top right corner of the Areas of interest page
Step 2: Upload your GeoJSON or zipped SHP file
by either drag-and-dropping the file onto the drop area
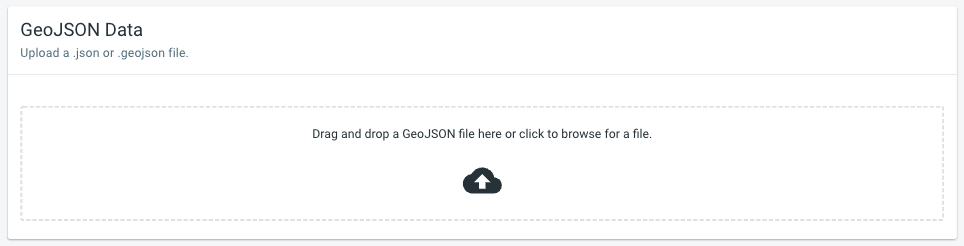
Figure 3. The drag and drop area
or by clicking the drag-and-drop area to select a file through a file chooser.
In case you want to upload a SHP file (which consists typically of 3 or more separate files), you need to first combine all the files into a single zip file before uploading.
Upload your Areas of interest
Step 3 (optional): Edit properties and filters
At this point, your background layer is already created and available. If needed, you can edit the properties and filters.
-
The name of the background layer is used in the UI when we need to refer to that layer
-
The description of the background layer is shown on the overview page with all the background layers. This is a good location to add some more details about this layer.
|
You can use HTML tags in the description
The description supports a subset of HTML tags. You can for example use it to |
-
The area display name property is the property in the GeoJSON/SHP data used to label the data when shown on the map.
For example if you have a GeoJSON/SHP file containing all countries in the world, and the GeoJSON/SHP data has properties like
name,continent,population, you could select thenameproperty as area display name property. When the data is visualized with labeling enabled, both the shapes of the countries and the name are displayed.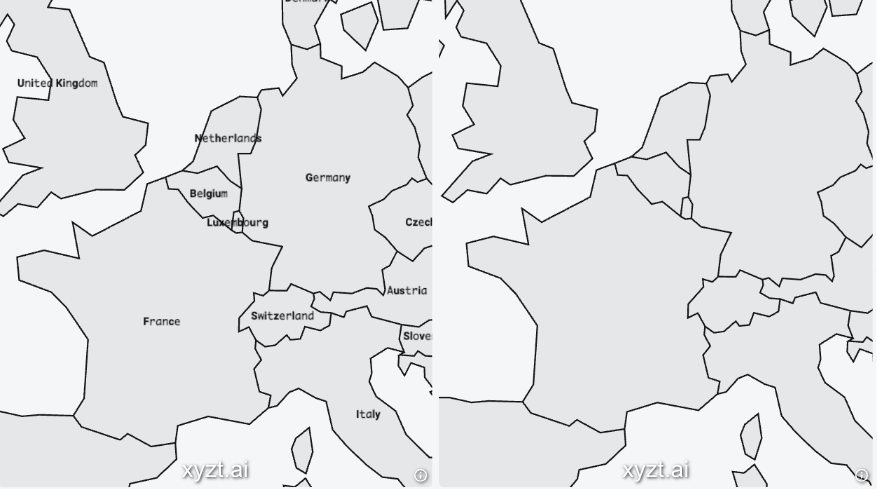 Figure 4. Two maps: labeled vs non-labeled GeoJSON/SHP layer
 -
The distance threshold is allows to increase the size of the shapes.
For point data, a non-zero distance threshold will convert the points to a circular area of interest with the specified distance as radius.
For polygon data, it is a threshold distance to expand the area by the given amount of meters. This can be useful, for example, when analyzing foot traffic surrounding an exhibition booth.
-
Remove certain features by defining a filter.
When your GeoJSON/SHP data has properties, you can only include the features or shapes of which the properties match your filter. Changes made to the filter will be previewed immediately.
For example if you have a GeoJSON/SHP file containing all countries in the world, and the GeoJSON/SHP data has properties like
name,continent,population, you can define a filter to include the countries of Europe with a population above 20 million people.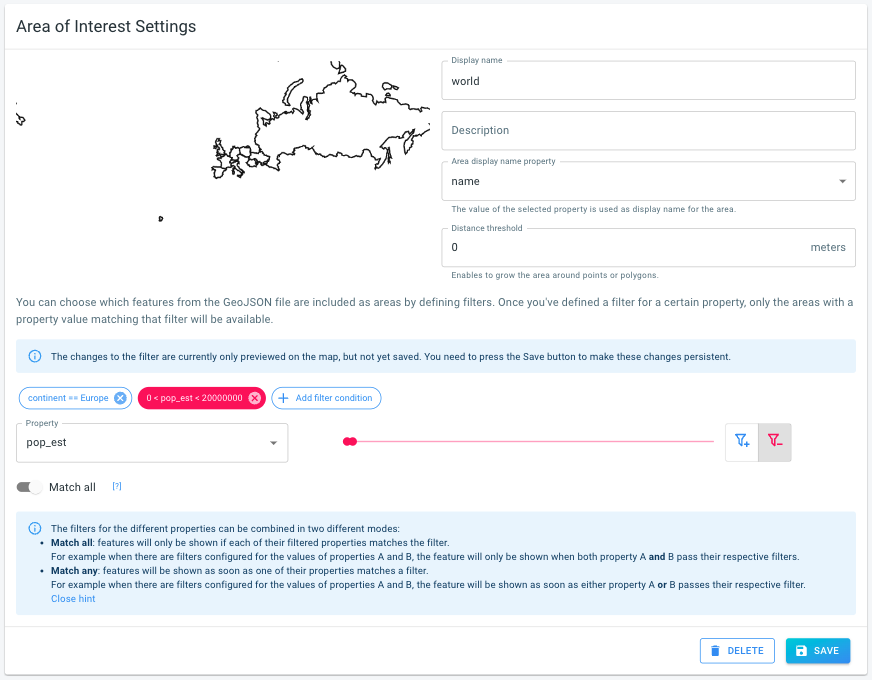 Figure 5. The Areas of interest settings
After you have changed the settings, press the Save button to apply them.
|
You can always edit these settings later
You can always adjust these settings at a later time:
|
Drawing areas of interest on the map
You can always draw new areas of interest on the spatial map on the Visual Analytics page in case you don’t have a GeoJSON/SHP file with the areas you are interested in.
Got feedback? Additional questions? Just want to have a friendly chat?
Get in touch!