Got feedback? Additional questions? Just want to have a friendly chat?
Get in touch!
Timezones on the trend analytics page
The trend analytics page uses a single timezone per trend chart.
-
When you’re only analyzing the global trend, there is only a single timezone.
-
When you’re also analyzing local trends, each local trend and the global trend have their own timezones.
You can change the timezone in the upper-right corner of each trend card.
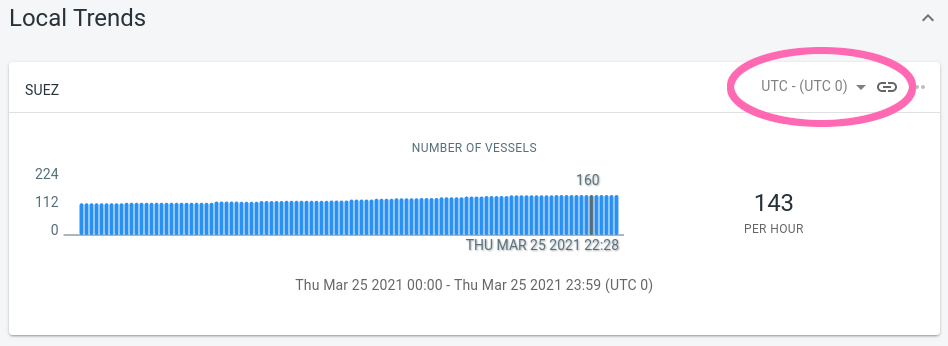
Figure 1. The (disabled) timezone selector on a local trend card
By default, all local trends use the same timezone as the global trend and their timezone selector UI is disabled. Changing the timezone of the global trend will also change the timezone of the local trends.
By clicking on the link icon, you can break this link between global and local trend timezone and select a different one for the local trend. Once the link is broken, any changes made to the global trend timezone won’t affect the timezone of that specific local trend.
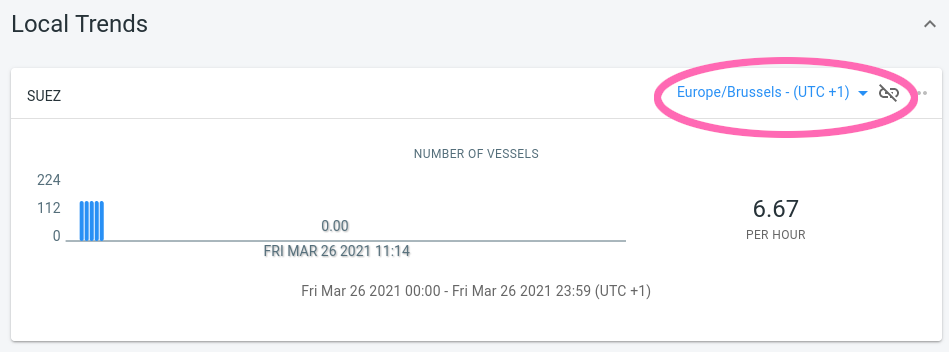
Figure 2. The timezone selector becomes enabled after clicking the link icon to break the link with the global trend’s timezone
What does the timezone affect ?
-
The timestamps we show in the UI will be converted to the correct timezone.
For example, consider an event that took place on 09:00AM UTC time.
-
When selecting UTC as timezone, the timestamp in the UI will display 09:00AM.
-
When selecting Europe/Brussels as timezone (= UTC+1), the timestamp in the UI will display 10:00AM because in Belgium, it was 10 in the morning when the event occurred.
-
When selecting America/New_York as timezone (= UTC-5), the timestamp in the UI will display 04:00AM.
-
-
The advanced time filters will be interpreted in the selected timezone.
The advanced time filters allow you to select which days of the week and/or hours in the day you want to see using the same UI as on the visual analytics page. For example, you can limit the data to weekdays only between 09:00 and 11:00AM.
Let us assume you have specified an advanced time filter to only include the data on Mondays and Tuesdays between 08:00AM and 10:00AM, and are using America/New_York as timezone.
In this case, the filter will for each event:
-
Check what the day and hour is for the event in the America/New_York timezone
-
Compare that day and hour with the day and hours defined in the advanced time filter. Only events on Mondays and Tuesdays between the specified hours will be accepted.
-
-
The selected time range changes by switching timezones.
In the time range panel, you can select an absolute (from 01 January 2020 at 10:00 AM until 05 January 2020 at 10:00 PM) time range or a relative one (the last 24h of data).
The absolute range is affected by the selected timezone. Just like the advanced time filters, the absolute range filter for each trend is evaluated in the selected timezone for that specific trend.
The relative range is unaffected. Asking for the last 24 hours of data always returns the same data, independent of the selected timezone. However, the timestamps on the trends will now be formatted in the selected timezone, as explained before.
Vertical alignment
The different trend card are aligned in such a way that the same "local" times are vertically aligned.
Assume you are looking at data from New York using the America/New_York timezone, and data from Los Angeles using the corresponding timezone. The events that happened in New York at 09:00 AM New York time will be vertically aligned with the events that happened at 09:00 AM in Los Angeles on the Los Angeles card.
This is illustrated in the picture below using timezones UTC and UTC+1.
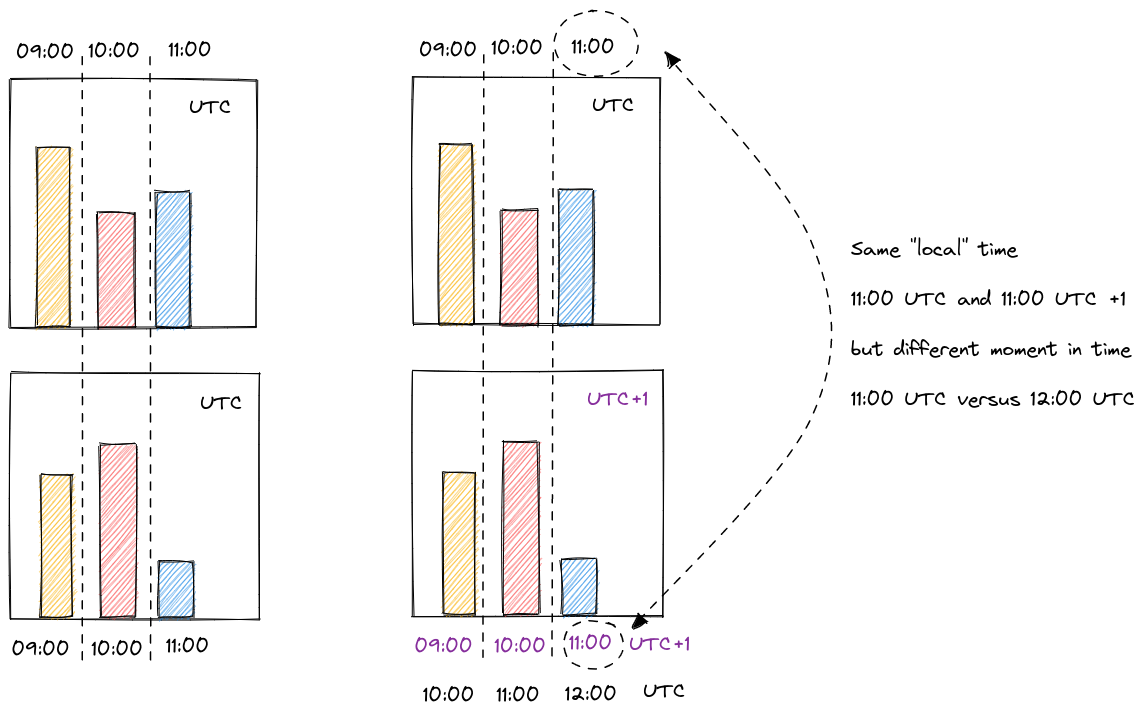
Figure 3. Illustration of the vertical alignment of the different trend charts
Example usages
Comparing trends in local time
Imagine you are a store owner with stores across different timezones, and you have data about the movement of your customers in each store.
By creating a local trend chart for each store, and selecting the correct timezone for store, you can easily compare how the different stores perform. Thanks to how we vertically align all those trend charts, you can see in a glance which store attracts the most people at for example 10:00AM local time for each store.
Comparing trends at a fixed moment in time
Imagine you want to analyze traffic numbers during the Superbowl event in different cities across the USA.
You can do this by:
-
Creating a local trend chart for each city
-
Do not use custom timezones, but stick to one timezone for all trend charts
-
Use the time range panel to select the Superbowl time in the timezone you are using
Each trend chart will now show the data for the city during the Superbowl event, without having to worry about at what the local time was in each city when the Superbowl took place.
Got feedback? Additional questions? Just want to have a friendly chat?
Get in touch!