1
2
3
4
5
6
7
8
9
10
11
12
13
14
15
16
17
18
19
20
21
22
23
24
25
26
27
28
29
30
31
32
33
34
35
36
37
38
39
40
41
42
43
44
45
46
47
48
49
50
51
52
53
54
55
56
57
58
59
60
61
62
63
64
65
66
67
68
69
70
71
72
73
74
75
76
77
78
79
80
81
82
83
84
85
86
87
88
89
90
91
92
93
94
95
96
97
98
import openapi_client
from openapi_client.rest import ApiException
from pprint import pprint
userName = "replace with your API user name"
password = "replace with your API password"
path = "/change/this/path/to/where/you/saved/the/files/"
# Enter a context with an instance of the API client
with openapi_client.ApiClient() as api_client:
# Create an instance of the API class
api_instance = openapi_client.AuthenticationJWTTokenApi(api_client)
login_request = openapi_client.LoginRequest(userName=userName, password=password)
try:
# Retrieve a JWT token
token_response = api_instance.obtain_token(login_request)
print("The response of AuthenticationJWTTokenApi->obtain_token:\n")
pprint(token_response)
# Set the obtained token in the headers for subsequent requests
api_client.default_headers["Authorization"] = f"Bearer {token_response.jwt_token}"
# Creating a project
print("Creating a new project")
projects_api = openapi_client.ProjectsApi(api_client)
project = projects_api.create_project(
openapi_client.CreatePublicProjectRequest(
name="New York Taxi",
description="Project created with the REST API"
)
)
# Creating a Mapbox background layer and adding it to the project
print("Creating a Mapbox light background layer")
map_data_api = openapi_client.BackgroundLayersAndAreasOfInterestMapdataApi(api_client)
background_layer = map_data_api.create_mapbox_background_layer(
openapi_client.CreatePublicMapboxMapDataRequest(
type='LIGHT'
)
)
print("Attaching the Mapbox background layer to the project")
project_map_data_api = openapi_client.ProjectResourcesMapdataApi(api_client)
project_map_data_api.add_map_data_to_project(
project_id=project.id,
public_add_map_data_to_project_request=openapi_client.PublicAddMapDataToProjectRequest(
map_data_id=background_layer.id
)
)
# Creating and uploading a new time series data set and attaching it to the project
print("Creating a new data set")
data_sets_api = openapi_client.DataSetsApi(api_client)
data_set = data_sets_api.create_data_set(
openapi_client.CreatePublicDataSetRequest(
name="New York Taxi",
description="Data set created with the API",
type='TIME_SERIES_DATA',
assets_name="zones"
)
)
print("Defining the GeoJSON structure using a properties file")
data_sets_api.upload_time_series_metadata_definition_file(
data_set_id=data_set.id,
file=path + "geojsonproperties.csv"
)
print("Uploading the GeoJSON file")
data_sets_api.upload_geo_json_shape_file(
data_set_id=data_set.id,
file=path + "NYC_Taxi_Zones.geojson.gz"
)
print("Defining the time series data structure")
data_sets_api.upload_data_definition_file(
data_set_id=data_set.id,
file=path + "dataproperties.csv"
)
print("Uploading the time series data")
data_sets_api.upload_data(
data_set_id=data_set.id,
file=path + "taxidata.csv.gz"
)
print("Attaching the data set to the new project")
project_data_sets_api = openapi_client.ProjectResourcesDataSetsApi(api_client)
project_data_sets_api.add_data_set_to_project(
project_id=project.id,
public_add_data_set_to_project_request=openapi_client.PublicAddDataSetToProjectRequest(
data_set_id=data_set.id
)
)
except ApiException as e:
print("Exception when calling the REST API: %s\n" % e)
Got feedback? Additional questions? Just want to have a friendly chat?
Get in touch!
Available parts
- Goal
- Generate Python code to interact with xyzt.ai
- Setup and run your first API query with Python
- Automating platform actions using the REST API with Python
- Uploading data using the REST API with Python (current)
- Next steps
Step 4: Uploading your own data
In the previous step, you created a new project by attaching an existing data set.
In this step of the tutorial, we will create a new project, and create a new data set by uploading your own data to the platform.
|
Free trial accounts do not support uploading your own data
This part of the tutorial illustrates how you can upload your own data using the REST API, but this is not supported in a free trial account. Get in touch if you want to start uploading your own data, and you are using a free account. |
Step 4.1: Obtaining the data
In this tutorial, you create a new time series data set with 5 months of taxi fare data in New York City.
A time series data set is defined using one or more GeoJSON files containing the areas the time series data is defined for, and CSV files with the temporal data records that reference the GeoJSON shapes.
If you are unfamiliar with adding own data to the platform, it is highly suggested to follow this tutorial first.
For this tutorial download the following 4 files:
-
NYC_Taxi_Zones.geojson.gz: The GeoJSON file containing the geometry of the different taxi zone areas in New York
-
geojsonproperties.csv: A configuration file, defining how to use the above GeoJSON file in the data set you will create. For more information on how to define this file, see Geometry properties file syntax.
-
taxidata.csv.gz: The time series data defining for each taxi zone in the GeoJSON file, the average taxi fare, average number of passengers, average trip distance, etc. for a period of 5 months in 2017.
-
dataproperties.csv: A configuration file, defining the data types of the columns in
taxidata.csv.gz. For more information on how to define this file, see timeseries data properties file syntax.
Download these 4 files and place them in a single folder.
Step 4.2: Using the API to upload the data.
In this step, you use the generated Python API to perform following steps:
-
Obtain a JWT authentication token as before.
-
Create a new project
-
Create a new Mapbox background layer
-
Attach the background layer to the project
-
Create a new time series data set
-
Define the geometry properties for the data set
-
Upload the (gzipped) GeoJSON file with the New York city taxi zones
-
Define the time series data properties
-
Upload the (gzipped) CSV file with the New York city taxi trip fares data
-
Attach the new data set to the project
The below code is self-explanatory.
Copy-paste and save it in a file main5.py.
As before, adjust the userName and password.
In addition, also adjust the path referencing the folder where you saved the 4 files you downloaded in Step 4.1.
main5.py
Execute this script as before and verify that a new project is created with one data set and one background layer attached. Click on the data set card and monitor the processing. Initially, the data set processing job is queued.
Once the card indicates that all data is processed, you can open the Visual analytics page for this project and verify that the taxi zones are shown on the map. You can now analyze the data, by changing for example the color map and the value range as usual.
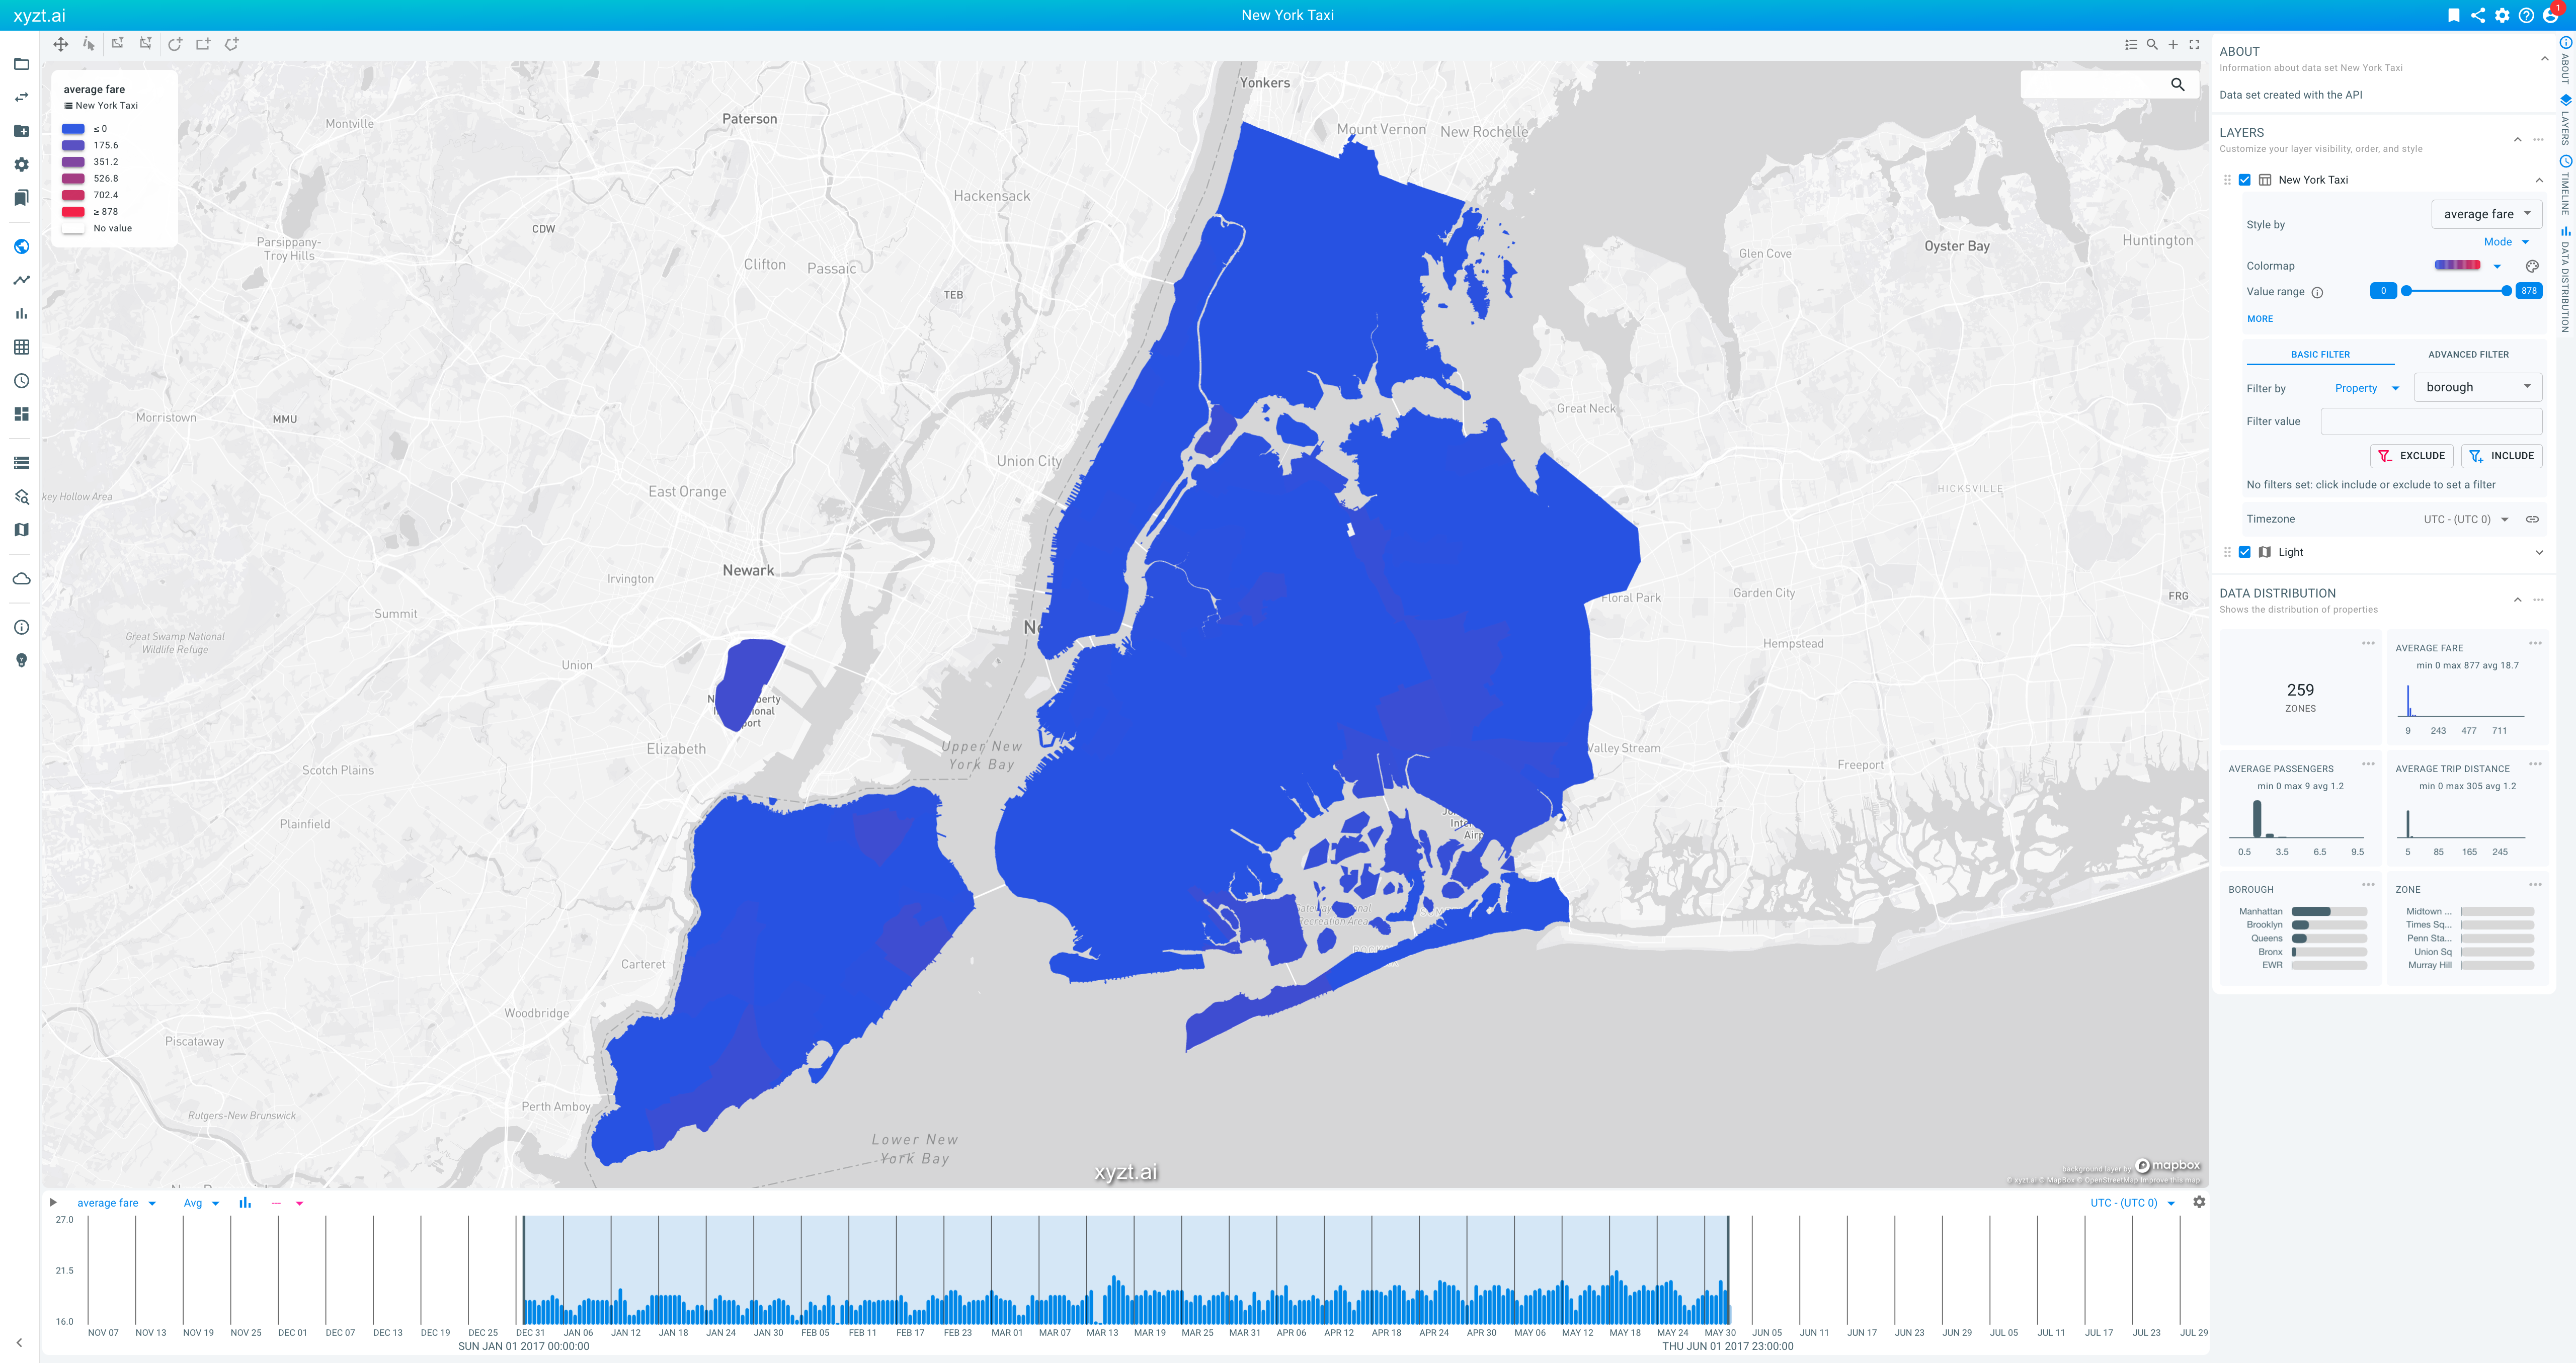
Figure 1. Default visual analytics view of the project and data set created in Step 4.2.
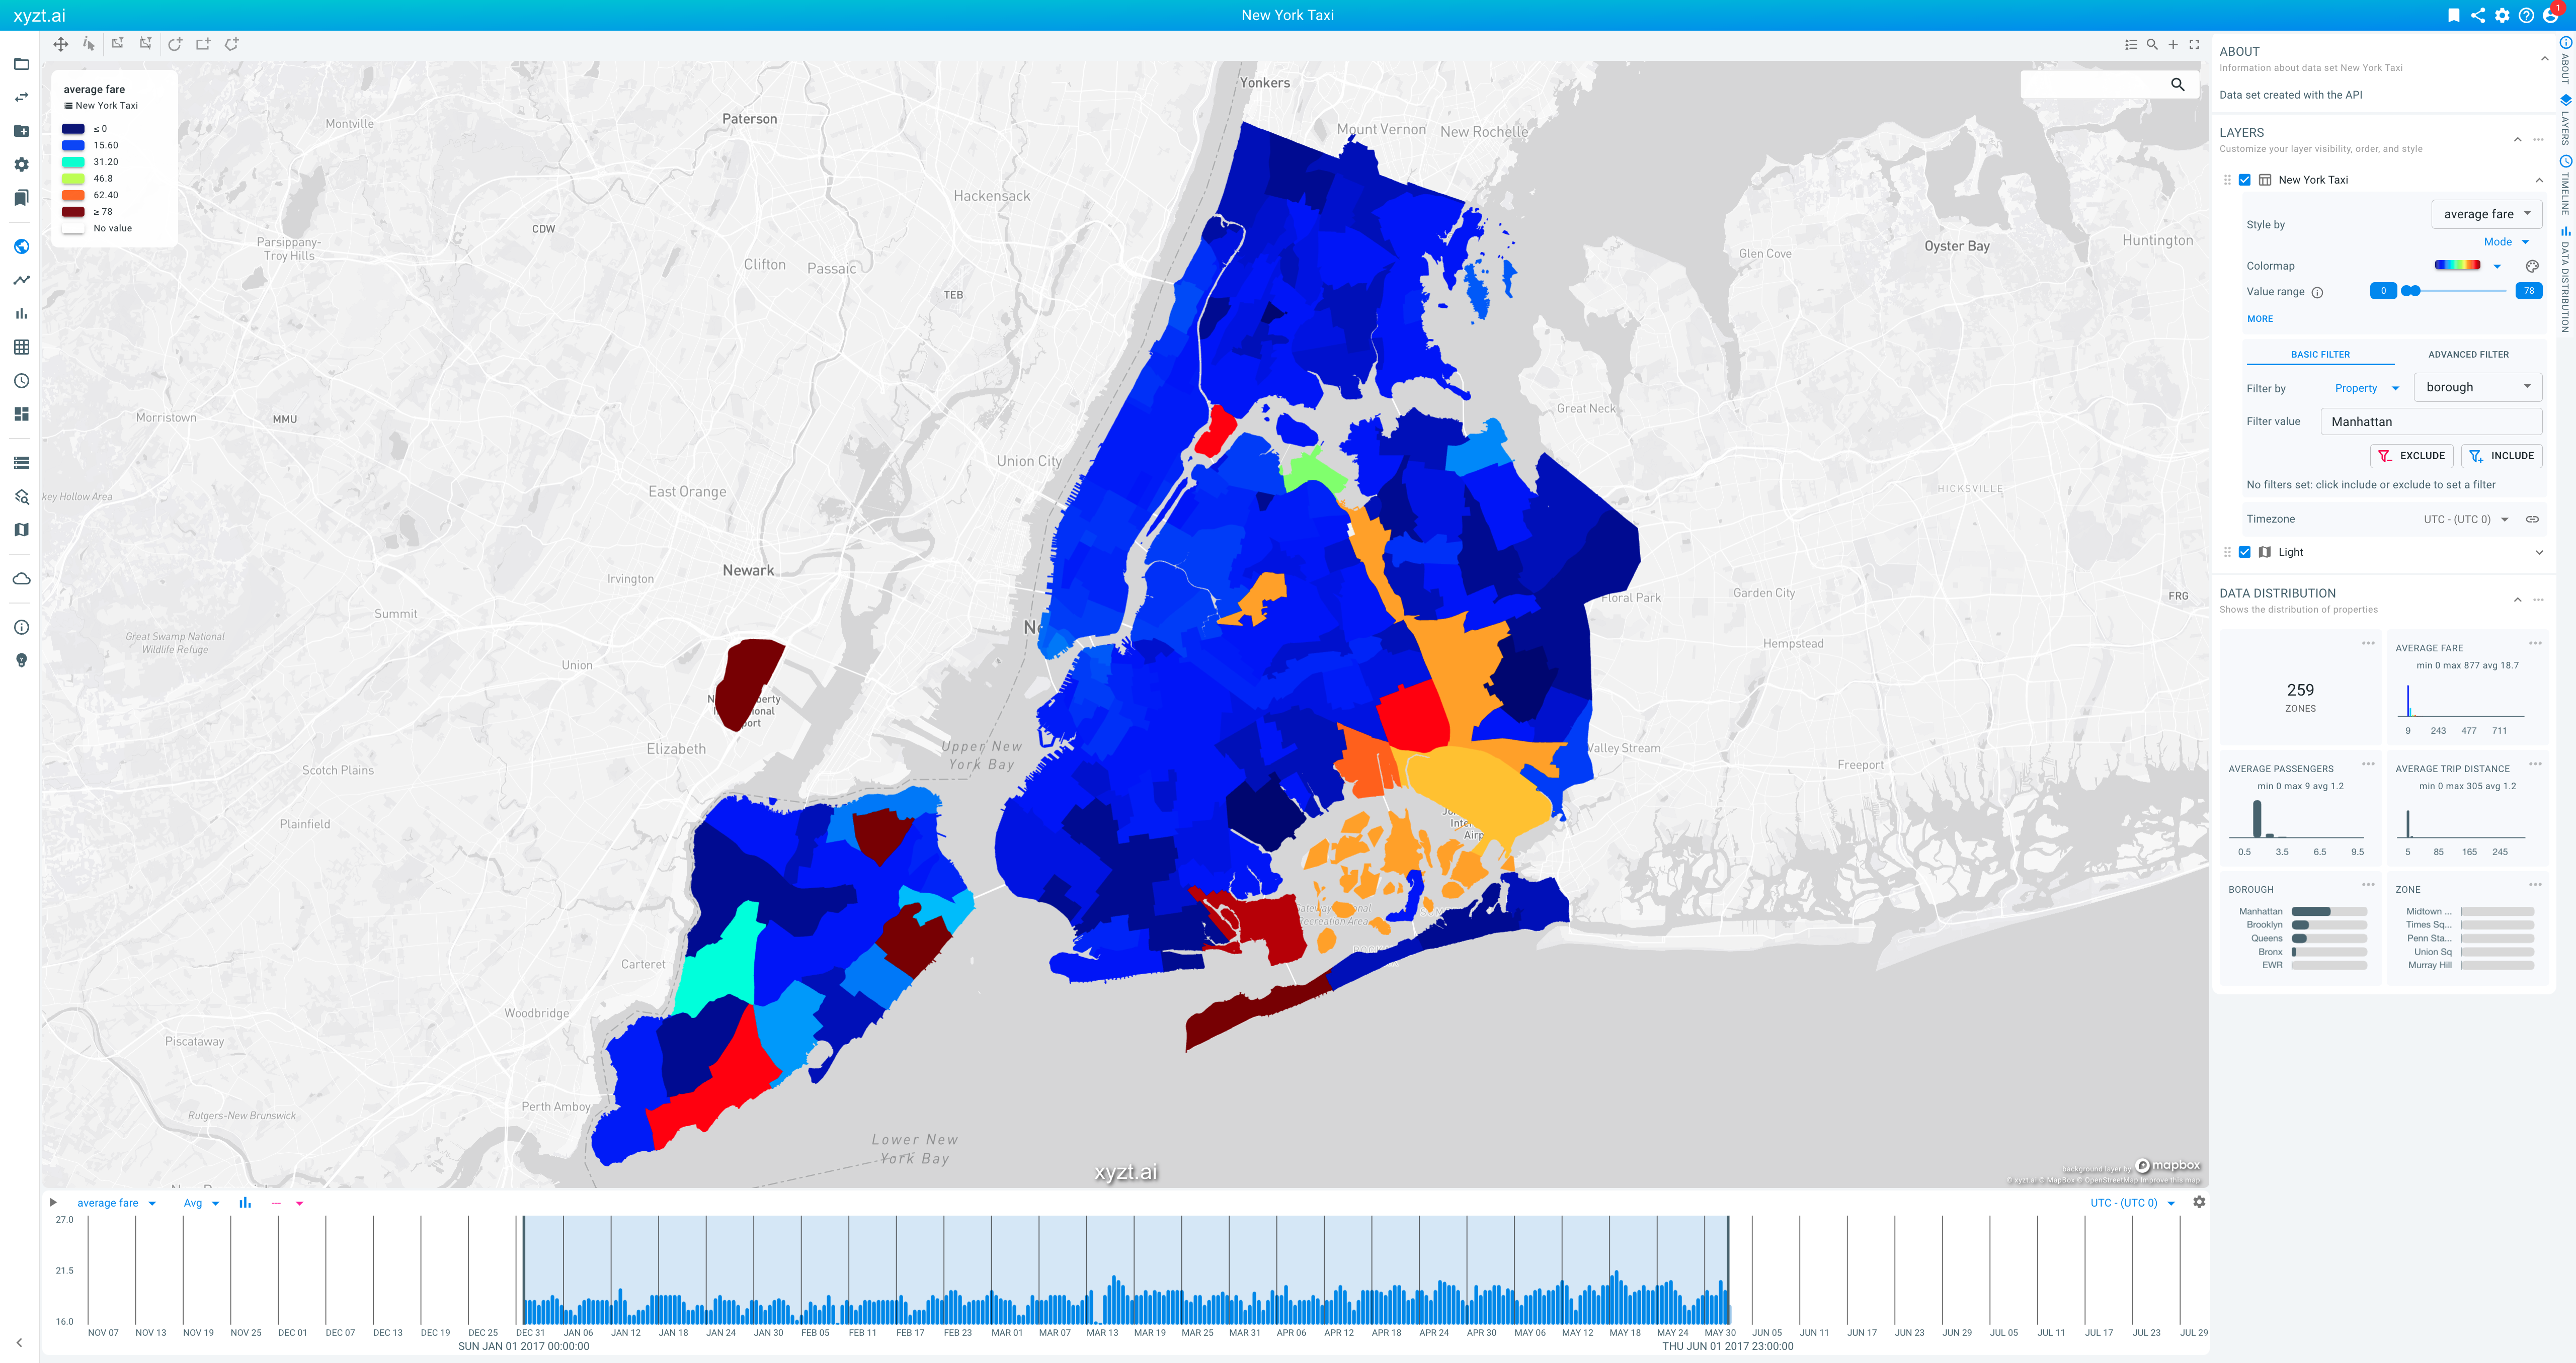
Figure 2. Visual analytics view after changing the color map and adjusting the value range slider to focus on the main taxi fare range.
That’s a wrap!
Congrats! With just about 100 lines of code, you have used a script to automatically create a new project, background layer, and upload your own time series data.
In addition to project creation, data upload, and dashboard creation, like you have done in this tutorial, you can also use the REST API to:
-
Perform data queries to obtain for example a trend line or a property distribution.
-
Create bookmarks to configure the (default) state of the different analytics pages.
-
Create shared links that enable to share or embed your projects.
-
And much more.
Next part
Go to the next part: Next steps
Got feedback? Additional questions? Just want to have a friendly chat?
Get in touch!