
Got feedback? Additional questions? Just want to have a friendly chat?
Get in touch!
|
This article only applies to movement data
This article is only relevant when working with movement data, not when working with time series data. You can read more about the differences between the two in this article. |
The different types of data representations
Depending on how the data is processed, it can be presented during analysis in 3 different ways:
-
Gridded: provides all the data in a gridded representation, including historic records. This representation is enabled by default and cannot be disabled.
-
Trajectories: Provides all the data in a trajectory representation, including historic records.
-
Realtime: Only keeps the last seen (location) record of an asset. Typically, used when providing a real-time view of your assets or tracked people.
Gridded data representation
This is the default representation.
To maintain scalability and interactivity, the platform maintains an efficient gridded data representation that allows quick aggregation and querying. This means that after you upload data, a processing engine is invoked so that after processing, you get immediate access to your data and the statistics.
The grid used in this representation has a configurable spatial and temporal resolution.
Figure 1. Data visualized on the spatial map using the gridded data representation
Trajectories
When set, the processing engine will generate trajectories for each asset. Trajectories are consecutive sequences of location records that belong together. Think of them as space-time lines.
When should you enable this? When you want to connect movement records and visualize the lines or trajectories the cars, vessels, etc. have followed. Note that trajectories are visualized client-side, and the number of trajectories that can be visualized at once is limited.
It is recommended to first get familiar with this data representation using a small data set, before deciding to use it on larger data sets.
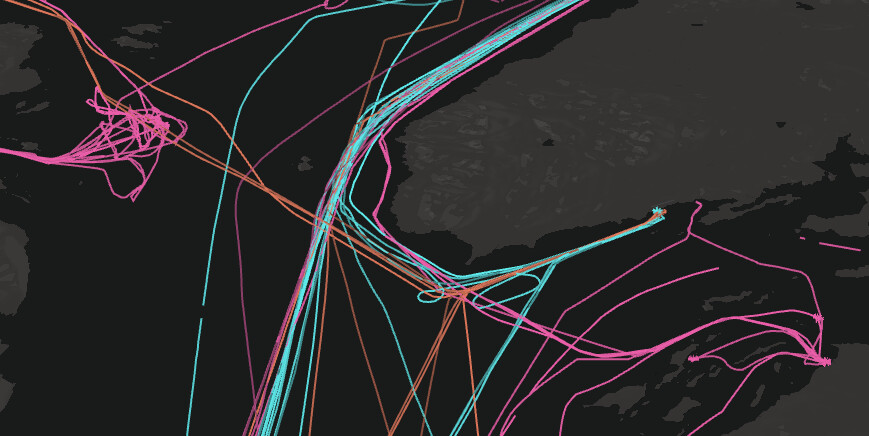
Figure 2. Data visualized on the spatial map using the trajectories data representation
Realtime
When the Realtime data representation is enabled, the processing engine will store for each car, vessel, etc. the last seen location together with its properties. This data representation can then be enabled when analyzing or visualizing the data in the Visual Analytics page, focusing on the last reported location and state.
You can also use this data representation for events data, e.g., when your data set consists of discrete events, that you want to plot on the map.
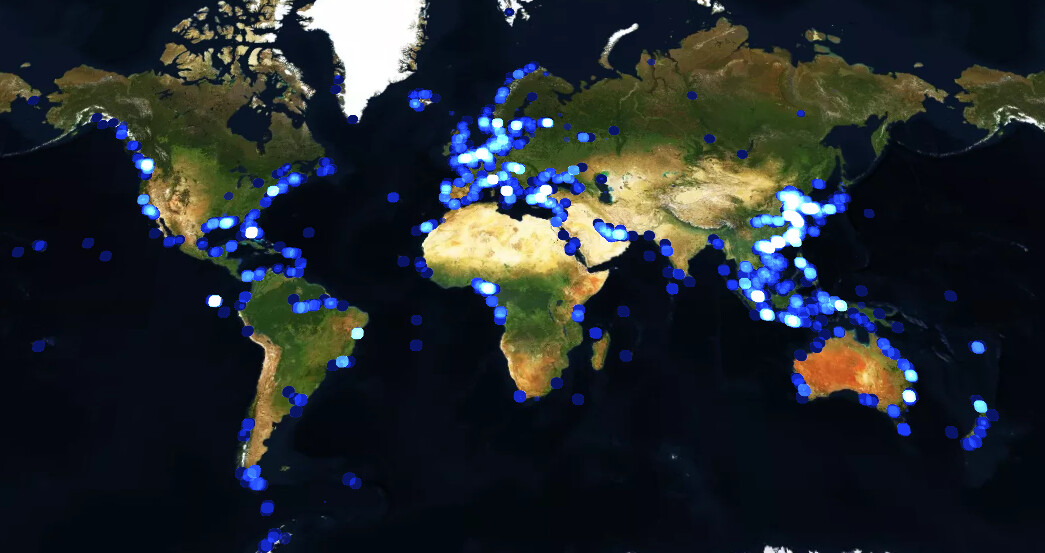
Figure 3. Data visualized on the spatial map using the realtime data representation
Got feedback? Additional questions? Just want to have a friendly chat?
Get in touch!