
Got feedback? Additional questions? Just want to have a friendly chat?
Get in touch!
|
This article only applies to movement path data
This article is only relevant when working with movement path data, not when working for instance with movement data. You can read more about the differences between the different data set types in this article. |
Introduction
This article explains how to create a GeoJSON data set for use as the road network layer in a movement path data set.
|
New to data uploads? Follow the tutorial!
There is a tutorial available where you go through the whole process of uploading your movement path data to the platform. That is the best starting point for learning about movement path data the first time. |
Define the structure of the GeoJSON files
After you have created a new data set, you get redirected to the UI where you can adjust the properties of your data set.
At the top of the page, you will find the navigation bar or stepper that takes you through the process. The UI where you define the structure of your geometry files is located under the Configure Geometry properties step:
Figure 1. Steps to configure upload of time series data
The UI offers 3 different ways to define the structure:
-
Using a wizard. This is the recommended way when you are new to creating data sets. This is also the way that is used in the tutorial.
-
Using a properties file. Here you define the structure by uploading a special file containing the structure of your data. The benefit is that you can store such a file next to your data so it’s easy to re-use. The drawback is that creating this file is not super-intuitive.
-
Copy from another data set. When you have already created another data set which uses geometry files with the exact same properties, you can instruct the platform to copy those properties from an existing data set instead of having to re-define it.
More details on each of these methods are listed below.
Using the wizard
Each feature or shape in the geometries file should, besides the geometry, at least have an identifier property. The wizard asks you to define which property represents that id:
-
Identifier: This is the identifier of the road segment. This same identifier is used on each record in the movement path data files (the trips data) to indicate to which road segment the trip record belongs.
After defining this mandatory identifier, you can define additional properties by clicking the ADD PROPERTY button. A property can be free-form text (like the name of a road), an enumeration (like the road class), or a numeric value (like the road length).
There are 3 special properties that require attention when configuring road data sets:
-
Display name: Use with the prefix
displayname:in the configuration file, or select it through the drop-down box when configuring the property by selectingDisplay name for the areas -
Priority level: Use with the prefix
priorityLevel:in the configuration file, or select it through the drop-down box by selectingPriority visibility level…. Values should be between 1 and 9 where 1 is more important than 9. Use for instance to differentiate between highways, primary roads, secondary roads,etc. -
Reverse id: Use with the prefix
reverseId:in the configuration file, or selectID of the feature for the opposite direction on two-way streetsin the drop-down box. Two-way roads are often denoted with the negative of the other direction ID, for instance2342342_0and-2342342_0. Specify only the positive direction in your data set and add a reverseId property to point to the other direction.When configuring the reverse ID, the platform automatically configures traffic to be on the right hand side. You can change the traffic side in the General Settings. Setting the right traffic side affects the visualization of two-way roads on the map.
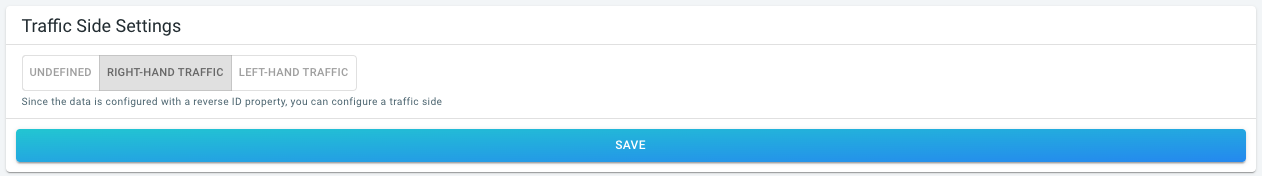 Figure 2. Configuring on which side of the road traffic drives.
|
Using a priority level is a must when working with large road network data sets. The platform will only visualize the features with level 1 when zoomed out and will gradually add features when zoomed in. If you leave out a priority level in your configuration, you might overload the browser with too many features resulting in degraded performance. |
|
Read the info messages on the right-hand side of the wizard
While you are using and going through the wizard, the info messages on the right-hand side of the wizard provide more information. |
|
Auto-detect properties to accelerate filling in the wizard
You can let the platform auto-detect the available properties by scanning one of your files. See this article for more information. |
Using a data properties file
A data properties file is a CSV file describing the different properties present in the GeoJSON files. Each row in the CSV file specifies another property
-
Row 1 specifies the details of the first property.
-
Row 2 the details of the second property.
-
…
The structure and syntax of this data properties file is explained in detail in this article.
Once you created such a file, you can upload it by drag-and-dropping it on the drop area:
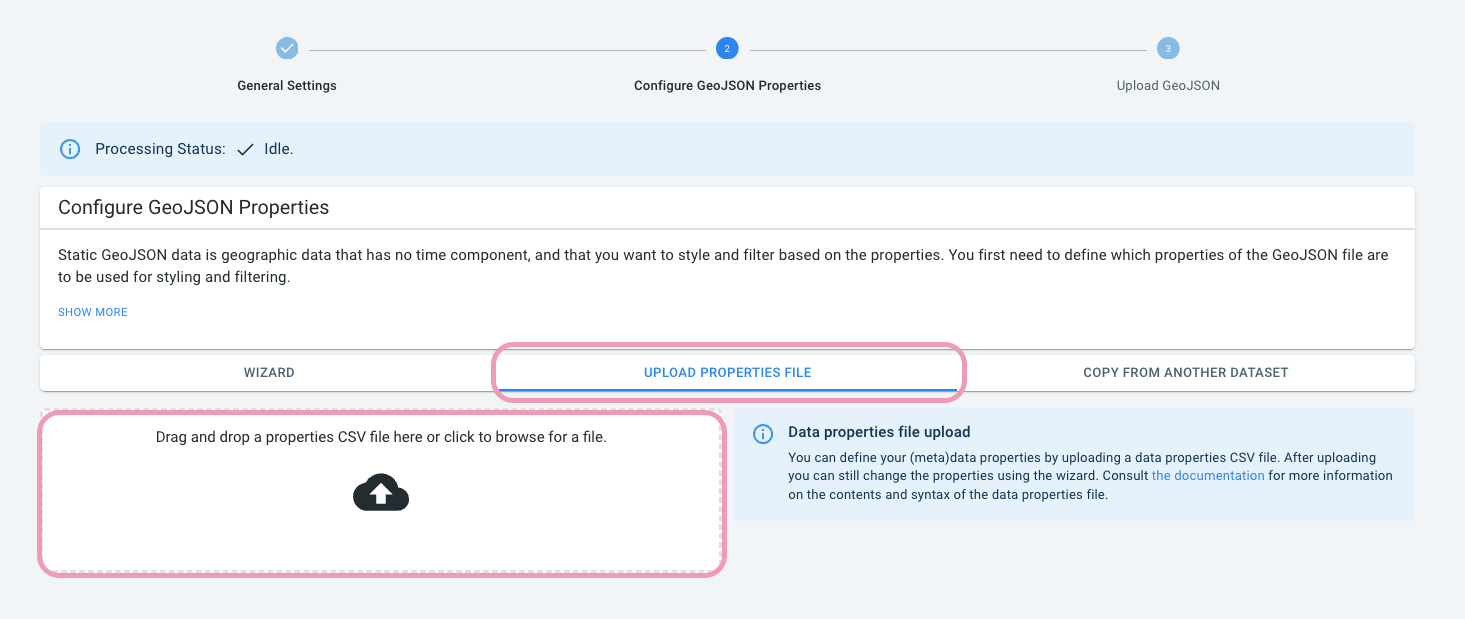
Figure 3. You can define what properties to use from the geometry file using an external configuration file in CSV format.
Copying from another data set
In case you already created a data set before, and your new data set uses GeoJSON files with the same properties, you can simply copy the properties definition.
Select the data set from which the geometry properties definition should be copied from the dropdown and press the Copy button.
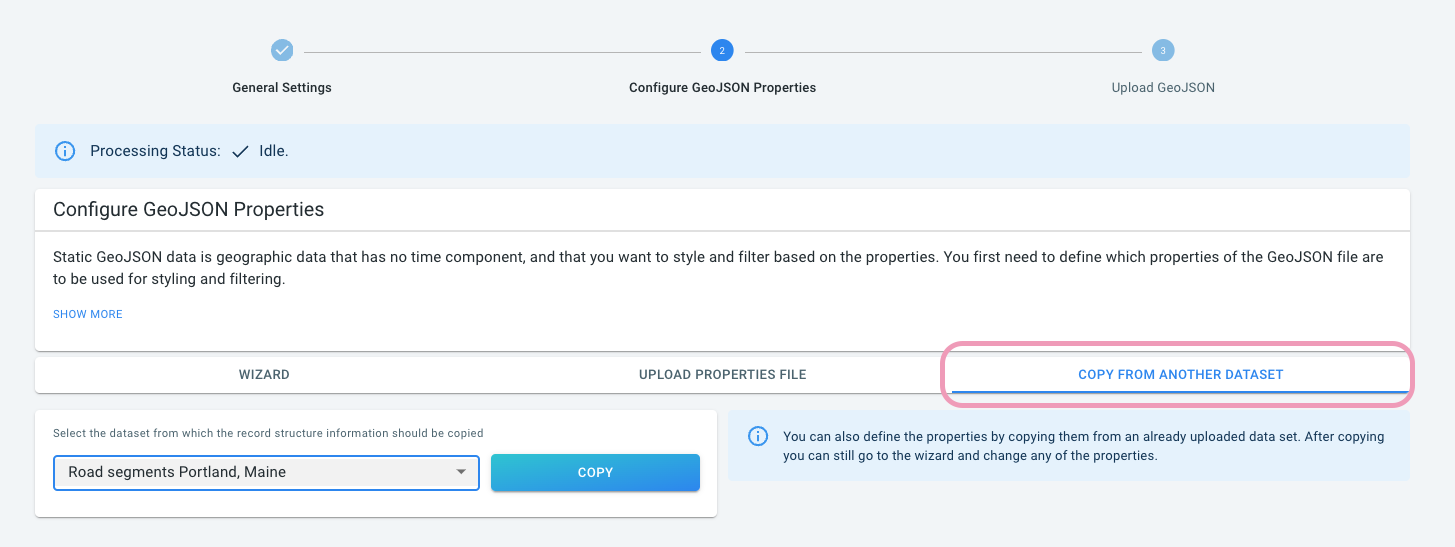
Figure 4. Defining the geometry file format by copying from an already existing data set.
Verifying your properties match your data files
If you’re unsure whether you’ve defined the properties correctly, you can use the validator to check.
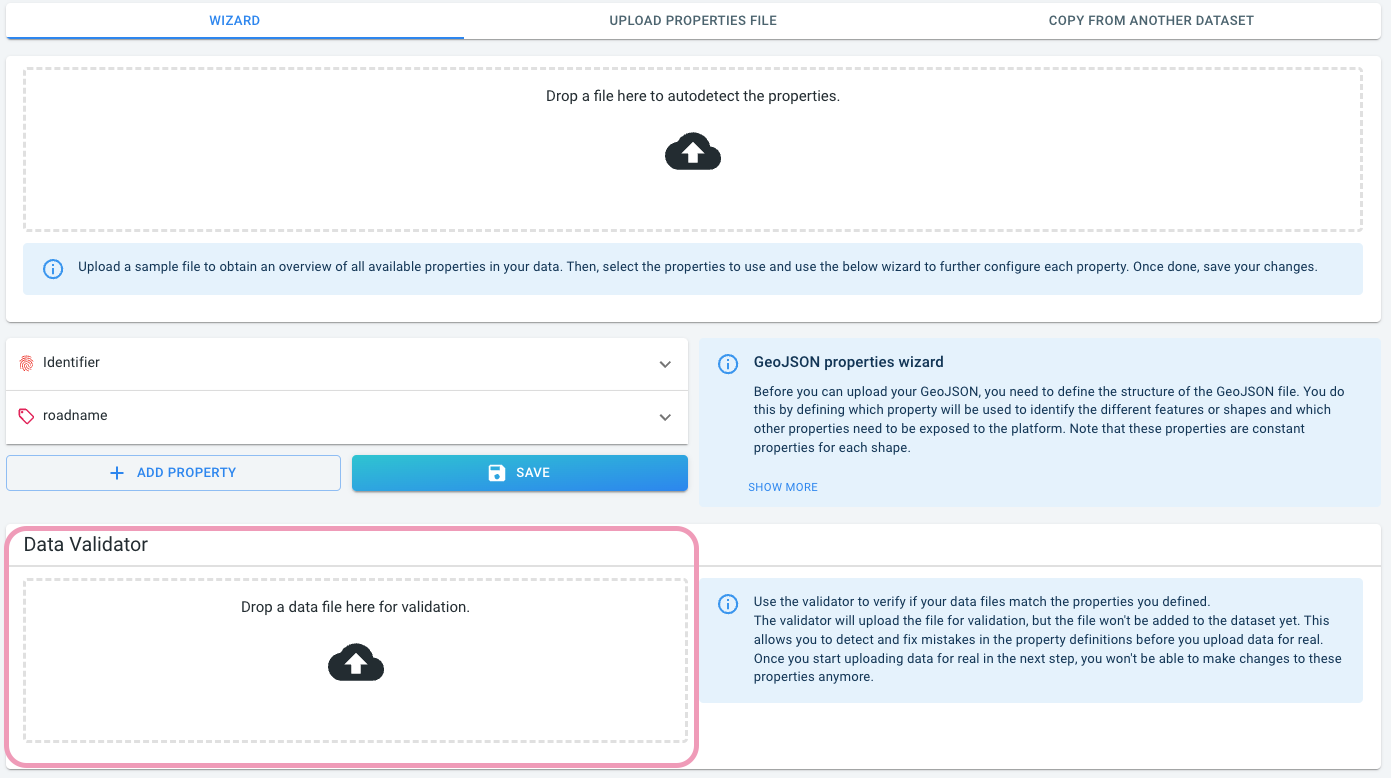
Figure 5. The data validator UI, which appears once you’ve defined the properties
The validator allows to upload a data file to the server, and the server will validate its contents against the defined properties.
In case there is a problem parsing your data file, you still have the opportunity to update your properties before you start adding data to the data set.
Got feedback? Additional questions? Just want to have a friendly chat?
Get in touch!