Got feedback? Additional questions? Just want to have a friendly chat?
Get in touch!
Introduction
When data is shown in the platform on the spatial map, in the data distributions or on the timeline, it is always a sampled version of the data.
This article explains how the platform calculates those results.
Terminology
The remainder of this article uses the following terminology:
-
Records: each row in your input data CSV files represents a single record.
-
Asset: each record contains an id, associating the data with a certain asset (or area in case of timeseries data).
For example, when working connected car data the asset would be a car, and each record was recorded by a car. -
Filters: when using the platform, you can filter your data spatially, temporal and on data properties. In the context of this article, any time filtering is mentioned it applies to any combination of those aforementioned filters.
-
Aggregation mode: during the calculation of the results (a tile on the spatial map, a bucket for the timeline histogram, …), the data of multiple records needs to be combined or aggregated into a single value. The platform offers different strategies to do so (for example using the average value or the minimum value), and this article refers to those strategies as aggregation modes.
The data pipeline
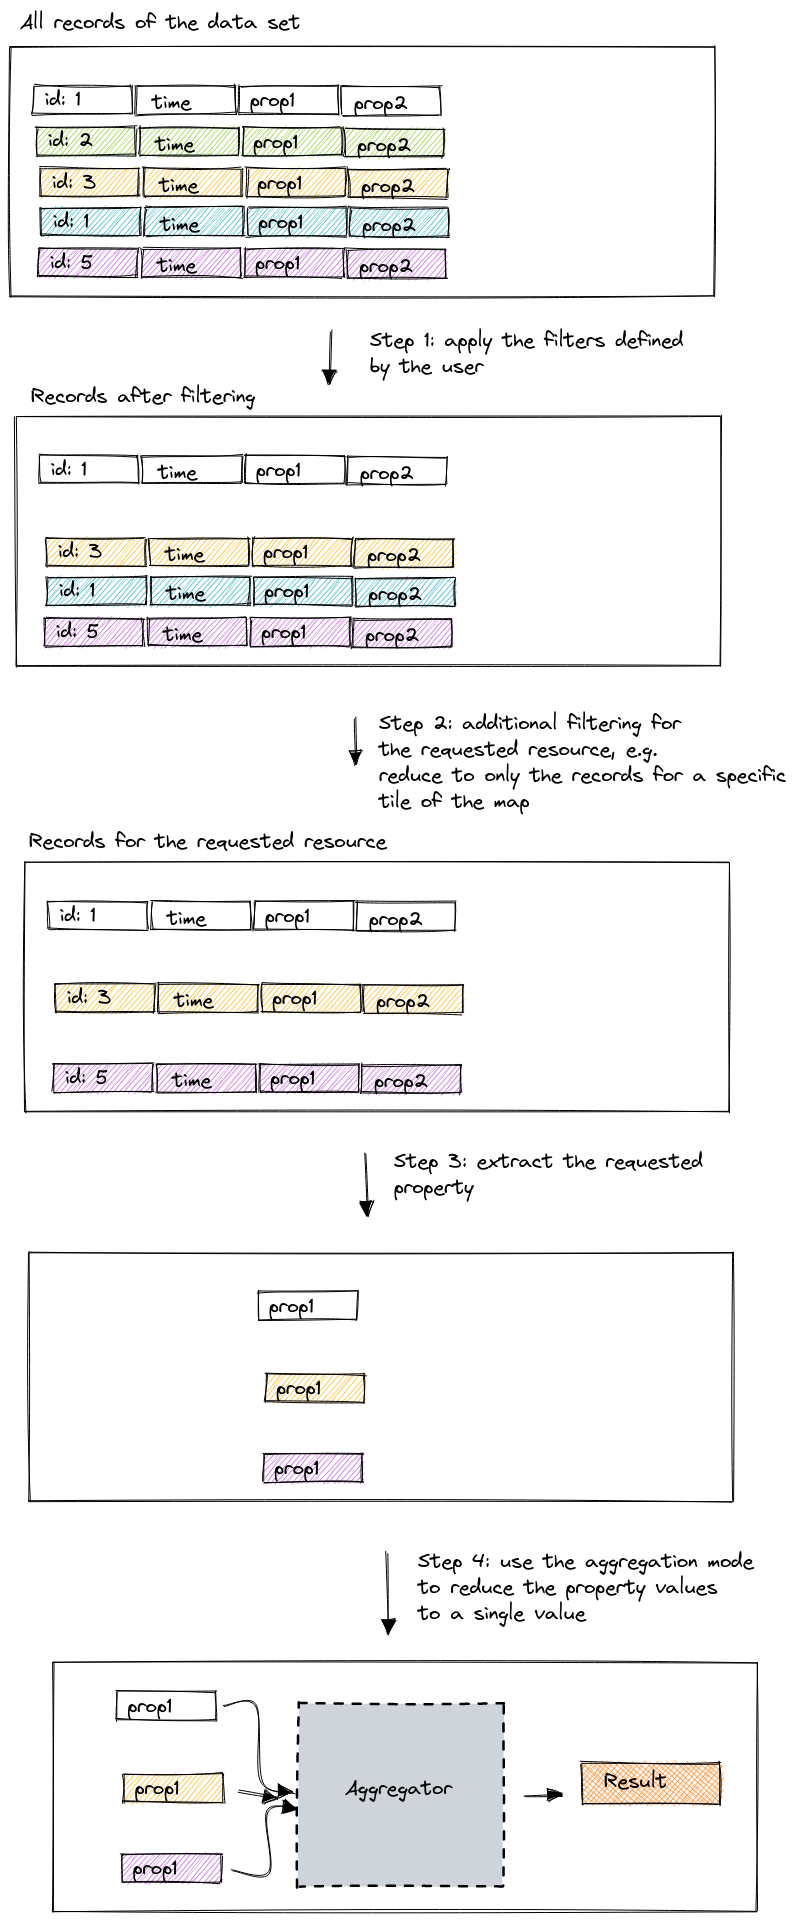
The data pipeline consists out of the following steps:
-
It starts from all the records in your data set
-
This set is filtered using the filters you defined in the platform
-
Depending on the resource that is requested (a tile of the spatial map, a bucket in the timeline histogram, …), this set is filtered down even further
-
From each of the remaining records the requested value is extracted.
-
In the last step, that set of individual values is converted into a single value using the user-selected aggregation mode
Figure 1. The data pipeline
The available aggregators
The platform offers the following aggregators. Note that not all of them are applicable for each property.
-
Average: the average is calculated by taking the sum of all values, and dividing by the number of values
-
Minimum: the minimum aggregation mode takes the minimum of all values
-
Maximum: the maximum aggregation mode takes the maximum of all values
-
Mode: the mode or most frequent value loops over all values and counts how many times they occur, and then returns the most occurring value. When more than 1 value occurs the most frequent, one of them will be selected at random.
|
Aggregators work on records, not on assets
Due to how the data pipeline works, all these aggregators work on the records and not on the assets. It is important to keep this in mind when evaluating the results. For example, if your data set contains measurements from 2 sensors with a different sampling rate, there might be a lot more records from one sensor, skewing the results. |
Handling of metadata properties
Some datasets contain both data and metadata (see the data versus metadata article for more information about the difference).
Both metadata properties and regular properties are handled in the same way. For each record that passes the filters, the property value will be extracted and passed to the aggregator.
This implies that when working with a metadata property, if the record with id 1 occurs 5 times, the metadata property value for id 1 will be included 5 times.
Examples
Spatial map: filtering versus adjusting the color map
Imagine that you are visualizing AIS data (=vessel or ship data) on the spatial map, and you are coloring the tiles by ship type using the mode aggregation mode:
-
Green: oil tankers
-
Yellow: fishing vessels
And on the map, you have the following tiles:
 _______ ________ ________
| Green | Yellow | Green  |
|_______|________|________|
This means that, from left to right, those locations contain mostly oil tankers, fishing vessels and oil tankers respectively.
If you know define a filter that excludes the oil tankers, you might expect
 _______ ________ ________
| Empty | Yellow | Empty  |
|_______|________|________|
because you filtered out the oil tankers.
But this is not necessarily the case. The data pipeline:
-
First filters the records
-
Then aggregates the values
By filtering out the oil tankers before aggregating the values, the aggregator will receive either:
-
No data when your original data only contained oil tankers at that specific location, resulting in an empty tile.
-
Only fishing vessels when your original data contained a mix of oil tankers and fishing vessels at that specific location. This will now result in a yellow tile.
So you could for example end up with
 ________________ ________
| Yellow | Yellow | Empty  |
|________|________|________|
In case you wanted to hide the tiles with the oil tankers, you should have adjusted the color mapping for the spatial map and use a transparent color for the oil tankers.
Got feedback? Additional questions? Just want to have a friendly chat?
Get in touch!