Got feedback? Additional questions? Just want to have a friendly chat?
Get in touch!
Timezones on the visual analytics page
The visual analytics page uses timezones in two different places:
-
The timeline has a timezone. The times shown on the timeline are displayed in that timezone.
-
The advanced time filters you can define for each dataset have a timezone associated with them
Timezone on the timeline
The times on the timeline are displayed in the timezone of that timeline.
-
When you’re working with a single map, there is only a single timeline that uses a single timezone.
-
When you’re doing a side-by-side comparison of 2 maps, each map has its own timeline. Each of these 2 timelines can use its own timezone.
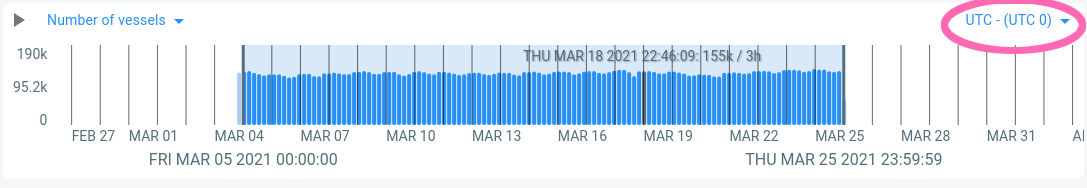
You select the timezone for a timeline in the top-right corner of the timeline:
Figure 1. The timezone selector in the top-right corner of the timeline
The timestamps shown on the timeline are converted to the currently used timezone.
For example, consider an event that took place on 09:00AM UTC time.
-
When selecting UTC as timezone, the timestamp on the timeline will display 09:00AM.
-
When selecting Europe/Brussels as timezone (= UTC+1), the timestamp on the timeline will display 10:00AM because in Belgium, it was 10 in the morning when the event occurred.
-
When selecting America/New_York as timezone (= UTC-5), the timestamp on the timeline will display 04:00AM.
Timezone on the advanced time filters
When you create an advanced time filter for a dataset, the times in that filter are interpreted in the timezone specified for the time filters.
You can choose a single timezone for advanced time filtering per dataset. The UI to select this timezone is right below the filtering UI in the Layers panel:
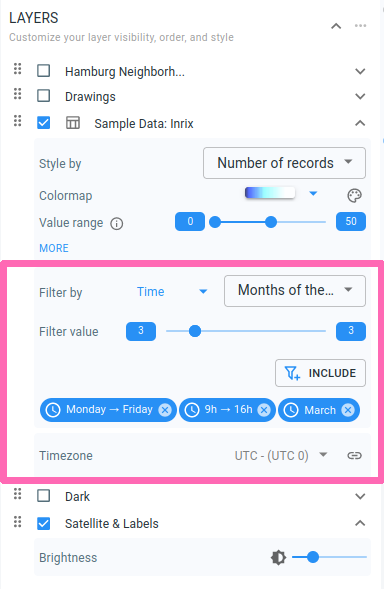
Figure 2. The timezone can be selected at the bottom of the filter UI in the Layers panel
Let us assume you have specified an advanced time filter to only include the data on Mondays and Tuesdays between 08:00AM and 10:00AM, and are using America/New_York as timezone.
In this case, the filter will for each event:
-
Check what the day and hour is for the event in the America/New_York timezone
-
Compare that day and hour with the day and hours defined in the advanced time filter. Only events on Mondays and Tuesdays between the specified hours will be accepted.
Example usages
Using the timezone of the area you’re looking at
When you’re looking at traffic data in the city of New York, it makes sense to switch to the timezone of New York.
That way, the peak in traffic that happens during rush hour will be shown during the typical rush hours.
Using multiple timezones when comparing different regions
Comparing traffic numbers throughout the day in two cities in different timezones becomes easier if you use a different timezone for each map, matching the city you’re looking at.
That way, you can for example focus on the morning rush hour traffic by filtering data between 07:00AM and 09:00AM on weekdays, and use the same filter for both maps. It avoids having to manually convert times from one timezone to another.
Using a single timezone when looking at a particular event
If you want to analyze the traffic across the United States during the Superbowl and compare that with traffic at the same time during a regular day, you would stick to a single timezone, even when using multiple maps.
For example if the Superbowl took place at between 6:00PM and 09:00PM New York time, you would switch to the New York timezone and filter on that specific time range.
Now you know that all shown data is during the Superbowl times, even when you look at Los Angeles which is in a different timezone.
Got feedback? Additional questions? Just want to have a friendly chat?
Get in touch!