1
2
3
4
5
6
7
8
9
10
11
12
13
14
15
16
17
18
19
20
21
22
23
24
25
26
27
28
29
30
31
32
33
34
35
36
37
38
39
40
41
42
43
44
45
46
47
48
49
50
51
52
53
54
55
56
57
58
59
import {
AuthenticationJWTTokenApi,
DataSetsApi,
HttpBearerAuth,
ProjectsApi,
} from "./gen/api";
const userName = "replace with your API user name";
const password = "replace with your API user password";
async function getJWTToken() {
const authenticationApi = new AuthenticationJWTTokenApi();
return await authenticationApi
.obtainToken({
userName: userName,
password: password,
})
.then((r) => {
return r.body.jwtToken;
})
.catch((reason) => {
console.log(reason);
return null;
});
}
getJWTToken().then(async (token) => {
console.log("Got access token : " + token);
if (token == null) {
return;
}
//Use the obtained JWT token to create an authentication object
const authentication = new HttpBearerAuth();
authentication.accessToken = token;
const dataSetsApi = new DataSetsApi();
//Make sure all requests to the server use the JWT token
dataSetsApi.setDefaultAuthentication(authentication);
//Query for all the datasets
const dataSets = (await dataSetsApi.getAllDataSets()).body;
console.log(dataSets);
const projectsApi = new ProjectsApi();
projectsApi.setDefaultAuthentication(authentication);
//Create a new project
const project = (
await projectsApi.createProject({
name: "My first project",
description: "My first project created through the REST API",
})
).body;
console.log(project);
});
Got feedback? Additional questions? Just want to have a friendly chat?
Get in touch!
Available parts
- Goal
- Generate TypeScript code to interact with xyzt.ai
- Setup and run your first API query
- Automating platform actions using the REST API (current)
- Uploading data using the REST API
- Next steps
- Known issues
Step 3: Using the REST API
Now that you have successfully used the generated TypeScript code and accessed the xyzt.ai platform through the REST API, let’s explore some of the available capabilities.
In this step of the tutorial, we will create a new project, attach an existing data set and create a custom dashboard.
Step 3.1: Creating a new project
We will build on our previous script, and extend it to create a new project. This is done through the generated ProjectsApi:
App2.ts
Copy-paste the above code in a file App2.ts in the src folder.
Run the following commands to compile and run it:
npx tsc
node dist/App2.js
This prints the JWT token, the data sets as before, and finally the information about the created project, like this:
PublicProjectDTO {
  id: '5ee83889-30a2-4e46-aed4-06b5f8ed908e',
  name: 'My first project',
  description: 'My first project created through the REST API',
  owned: true
}
Step 3.2: Attaching an existing data set
You can create and upload your own data set.
See DataSetsApi or the API documentation website for the different steps needed to create a data set and upload data records.
In this step, however, you will be using an existing data set, and attaching it to the project we just created.
In the example code below, we take the first data set returned, but of course you can attach any of the returned data sets.
Copy-paste the below code and save it in a file src/App3.ts:
App3.ts
1
2
3
4
5
6
7
8
9
10
11
12
13
14
15
16
17
18
19
20
21
22
23
24
25
26
27
28
29
30
31
32
33
34
35
36
37
38
39
40
41
42
43
44
45
46
47
48
49
50
51
52
53
54
55
56
57
58
59
60
61
62
63
64
65
66
67
68
import {
AuthenticationJWTTokenApi,
DataSetsApi,
HttpBearerAuth,
ProjectResourcesDataSetsApi,
ProjectsApi,
} from "./gen/api";
const userName = "replace with your API user name";
const password = "replace with your API user password";
async function getJWTToken() {
const authenticationApi = new AuthenticationJWTTokenApi();
return await authenticationApi
.obtainToken({
userName: userName,
password: password,
})
.then((r) => {
return r.body.jwtToken;
})
.catch((reason) => {
console.log(reason);
return null;
});
}
getJWTToken().then(async (token) => {
console.log("Got access token : " + token);
if (token == null) {
return;
}
//Use the obtained JWT token to create an authentication object
const authentication = new HttpBearerAuth();
authentication.accessToken = token;
const dataSetsApi = new DataSetsApi();
//Make sure all requests to the server use the JWT token
dataSetsApi.setDefaultAuthentication(authentication);
//Query for all the datasets
const dataSets = (await dataSetsApi.getAllDataSets()).body;
console.log(dataSets);
const projectsApi = new ProjectsApi();
projectsApi.setDefaultAuthentication(authentication);
//Create a new project
const project = (
await projectsApi.createProject({
name: "My first project",
description: "My first project created through the REST API",
})
).body;
console.log(project);
const projectResourcesDataSetsApi = new ProjectResourcesDataSetsApi();
projectResourcesDataSetsApi.setDefaultAuthentication(authentication);
//Add the dataset to the project
await projectResourcesDataSetsApi.addDataSetToProject(project.id, {
dataSetId: dataSets[0].id,
});
});
Execute this script as before:
npx tsc
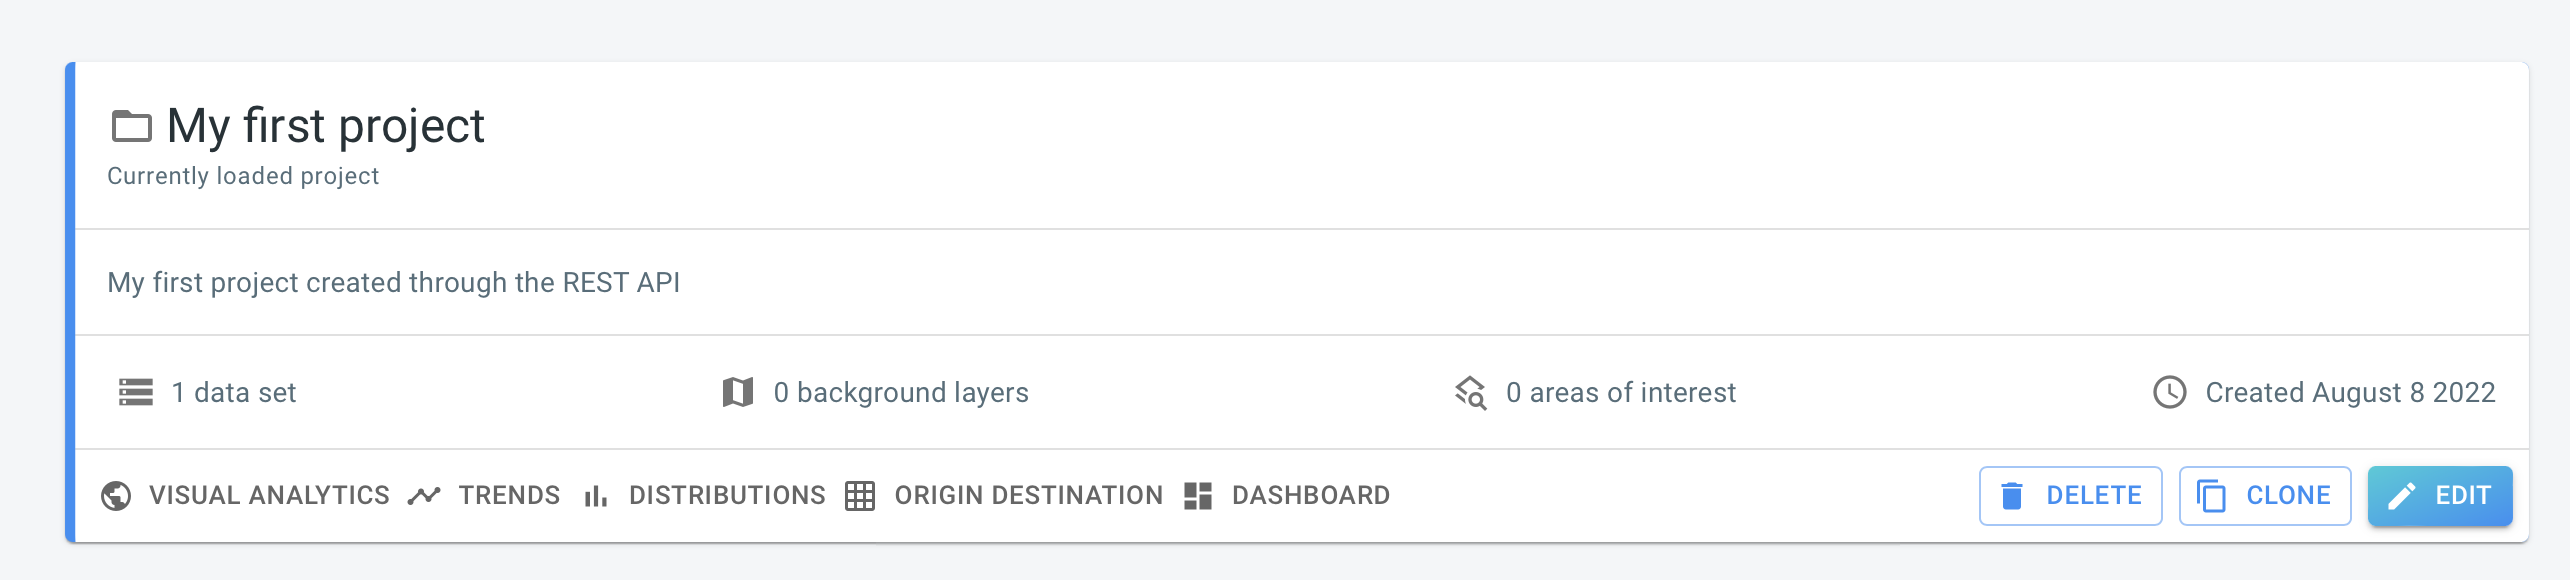
node dist/App3.jsVerify that a data set is now attached to the last created project by navigating to your platform account in a browser and opening the last created project. Note that the project card now mentions that 1 data set is attached.
Step 3.3: Populating a dashboard
As a final step, you will create a dashboard and populate it with a widget.
Each project has a single dashboard. Each dashboard can be populated with different widgets, grouped in so-called widget groups.
Widgets can be a map, a timeline, a bar chart,… . Such widgets always relate to one of the analytical pages, such as the Visual Analytics or Trend Analytics page. A widget is created by defining the state of the relevant page, e.g., should there be one or two maps? Which styling should be used on the map? What property and time filters should be applied? Etc.
Because there are many configuration possibilities for each of the analytical pages, the REST API is extensive. However, not all properties need to be defined. For example, if you don’t want to filter your data, you don’t need to define any (empty) filters.
The below code extends App3.ts and creates a widget group and populates the group with a map widget of the Visual Analytics page.
Copy-paste the code and save it as src/App4.ts.
Don’t forget to adjust the userName and password with the API username and password.
App4.ts
1
2
3
4
5
6
7
8
9
10
11
12
13
14
15
16
17
18
19
20
21
22
23
24
25
26
27
28
29
30
31
32
33
34
35
36
37
38
39
40
41
42
43
44
45
46
47
48
49
50
51
52
53
54
55
56
57
58
59
60
61
62
63
64
65
66
67
68
69
70
71
72
73
74
75
76
77
78
79
80
81
82
83
84
85
86
87
88
89
90
91
92
93
94
95
96
97
98
99
100
101
102
103
104
105
106
107
108
109
110
111
112
113
114
115
116
117
118
119
120
121
122
123
124
125
126
127
128
129
130
131
132
133
134
135
136
137
138
139
140
141
142
143
import {
AuthenticationJWTTokenApi,
DataSetsApi,
HttpBearerAuth,
ProjectResourcesDataSetsApi,
ProjectResourcesWidgetsApi,
ProjectsApi,
PublicTemporalRangeFilterDTO,
PublicVisualAnalyticsDataSetProperties,
PublicVisualAnalyticsGriddedDisplayOptions,
PublicVisualAnalyticsNamedHeatmapDTO,
PublicVisualAnalyticsSingleTimelineProperty,
PublicVisualAnalyticsWidgetProperties,
} from "./gen/api";
const userName = "replace with your API user name";
const password = "replace with your API user password";
async function getJWTToken() {
const authenticationApi = new AuthenticationJWTTokenApi();
return await authenticationApi
.obtainToken({
userName: userName,
password: password,
})
.then((r) => {
return r.body.jwtToken;
})
.catch((reason) => {
console.log(reason);
return null;
});
}
getJWTToken().then(async (token) => {
console.log("Got access token : " + token);
if (token == null) {
return;
}
//Use the obtained JWT token to create an authentication object
const authentication = new HttpBearerAuth();
authentication.accessToken = token;
const dataSetsApi = new DataSetsApi();
//Make sure all requests to the server use the JWT token
dataSetsApi.setDefaultAuthentication(authentication);
//Query for all the datasets
const dataSets = (await dataSetsApi.getAllDataSets()).body;
console.log(dataSets);
const projectsApi = new ProjectsApi();
projectsApi.setDefaultAuthentication(authentication);
//Create a new project
const project = (
await projectsApi.createProject({
name: "My first project",
description: "My first project created through the REST API",
})
).body;
console.log(project);
const projectResourcesDataSetsApi = new ProjectResourcesDataSetsApi();
projectResourcesDataSetsApi.setDefaultAuthentication(authentication);
//Add the dataset to the project
await projectResourcesDataSetsApi.addDataSetToProject(project.id, {
dataSetId: dataSets[0].id,
});
const projectResourcesWidgetsApi = new ProjectResourcesWidgetsApi();
projectResourcesWidgetsApi.setDefaultAuthentication(authentication);
//Widgets can only be added to a group, so first create a new WidgetGroup
const widgetGroup = (
await projectResourcesWidgetsApi.createWidgetGroup(project.id, {
name: "My API created widget group",
})
).body;
//Create the properties for the dataset
const propertiesPerDataSet: Record<
string,
PublicVisualAnalyticsDataSetProperties
> = {};
propertiesPerDataSet[dataSets[0].id] = {
griddedDisplayOptions: {
mode: PublicVisualAnalyticsGriddedDisplayOptions.ModeEnum.NumberOfRecords,
colorByNumberOfRecordsColorMap: {
heatMap: {
name: PublicVisualAnalyticsNamedHeatmapDTO.NameEnum.Rainbow,
},
},
},
};
//Then add a Visual Analytics widget to the group
await projectResourcesWidgetsApi.createVisualAnalyticsWidget(
project.id,
widgetGroup.id,
{
title: "Map fitted on entire area",
properties: {
widgetType:
PublicVisualAnalyticsWidgetProperties.WidgetTypeEnum.SpatialMap,
mapIndex: 0,
},
state: {
individualMapStates: [
{
temporalRangeFilter: {
endTimeType:
PublicTemporalRangeFilterDTO.EndTimeTypeEnum.BeforeEndOfData,
endTimeDeltaInSeconds: 0,
startTimeType:
PublicTemporalRangeFilterDTO.StartTimeTypeEnum
.BeforeEndOfFilter,
startTimeDeltaInSeconds: 60 * 60 * 24 * 7,
endTimeInSeconds: 0,
startTimeInSeconds: 0,
},
dataSetProperties: propertiesPerDataSet,
timeLineProperties: {
properties: [
{
dataSetId: dataSets[0].id,
mode:
PublicVisualAnalyticsSingleTimelineProperty.ModeEnum
.NumberOfAssets,
},
],
},
},
],
},
}
);
});
Now execute App4.ts:
npx tsc
node dist/App4.js
This script creates a single widget on the dashboard with a map showing the last week of data colored with the Rainbow heatmap.
Open the dashboard in your browser.
Notice how clicking on the widget will bring you to the Visual Analytics page with the state configured in the App4.ts script.
In the next step of the tutorial you will use the API to create a new project and upload new data to the platform.
Next part
Go to the next part: Uploading data using the REST API
Got feedback? Additional questions? Just want to have a friendly chat?
Get in touch!