Got feedback? Additional questions? Just want to have a friendly chat?
Get in touch!
Available parts
- Goal
- About INRIX trips data
- Uploading INRIX trips data
- Getting started using INRIX trips data (current)
Getting started using the INRIX trips data
Now that you created a new data set and uploaded the INRIX trips data, you can start using it for analysis. The steps to get started are:
-
Initialize a new project by providing a
nameanddescription. -
Attach the newly created data set with INRIX trips data to the project.
-
Attach a background layer such as one of the Mapbox layers.
-
Open the visual analytics page.
| In this tutorial you will perform all actions through the web interface. In case your account supports REST API access, all these actions can be automated and scripted. |
Step 1: Initialize a new project
Create a new project by:
-
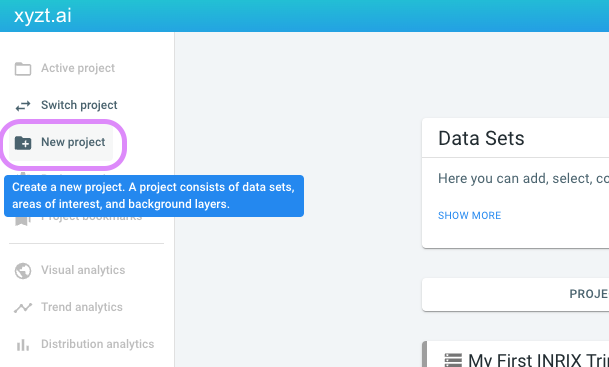
Clicking on the New project button on the navigation bar
Figure 1. Create a new project from the navigation bar on the left -
Providing a name and description and pressing the CREATE PROJECT button
-
name:
My First INRIX Project -
description:
Project using INRIX trips data
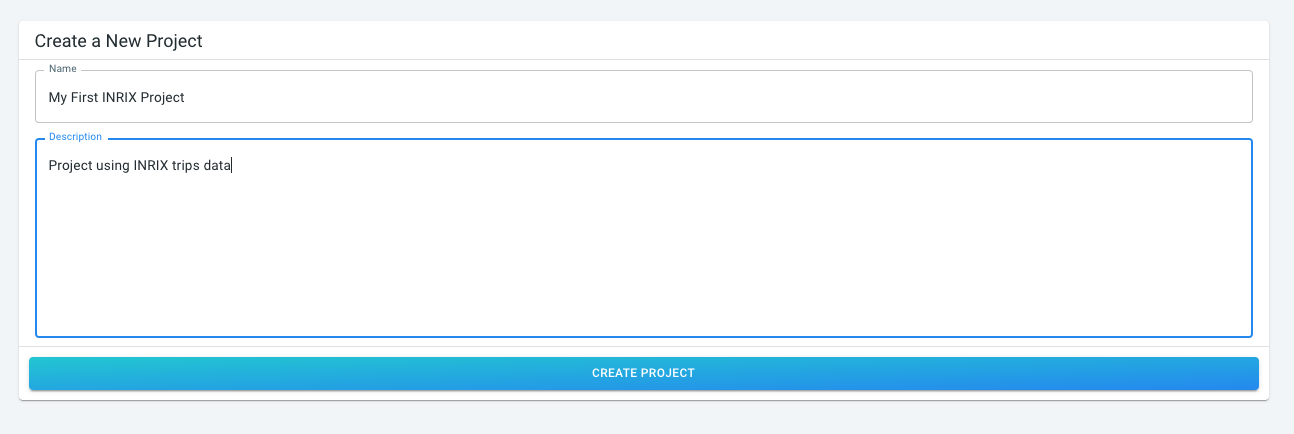 Figure 2. Provide a name and description
 -
Step 2: Attach the newly created data set
The newly created project is now the active project. On the following screen you can see shortcuts to the data sets, data stores, areas of interest, and background layers.
To add your newly created data set to the project, follow these steps:
-
Click on the Data Sets button
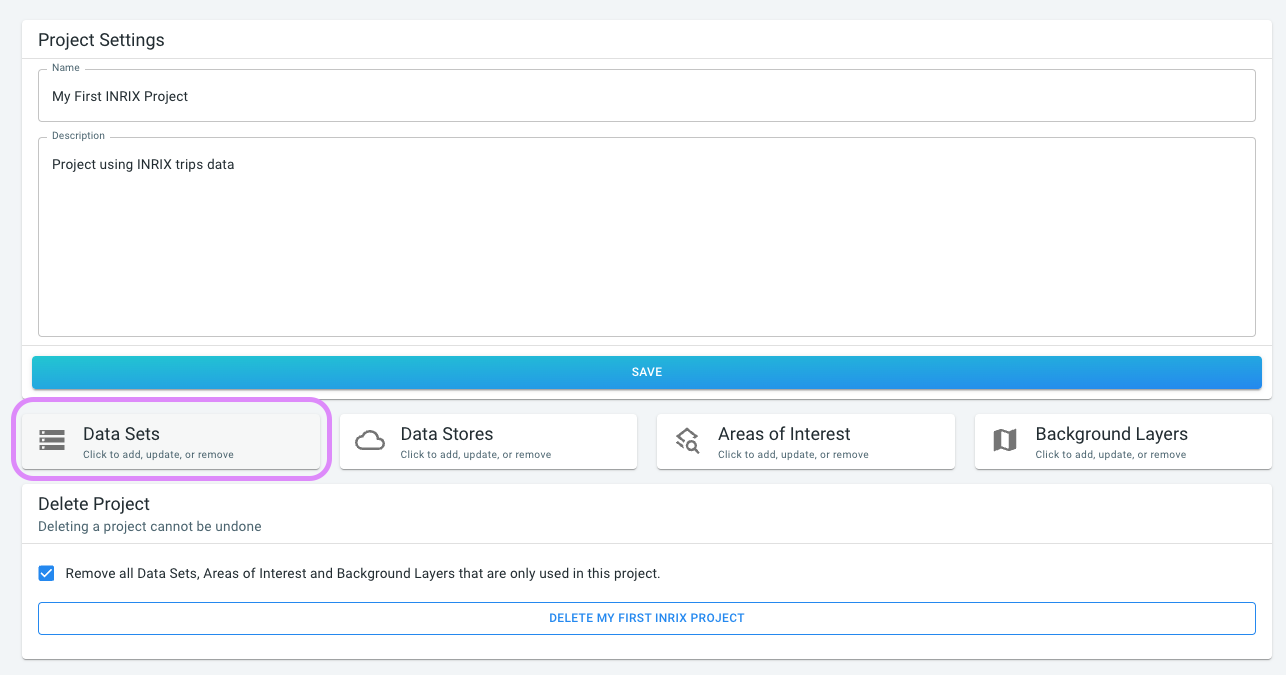 Figure 3. Attach resources such as data sets to the project
 -
Hit the YOUR DATA SETS tab and click on ATTACH on the card that corresponds to the data set you just created.
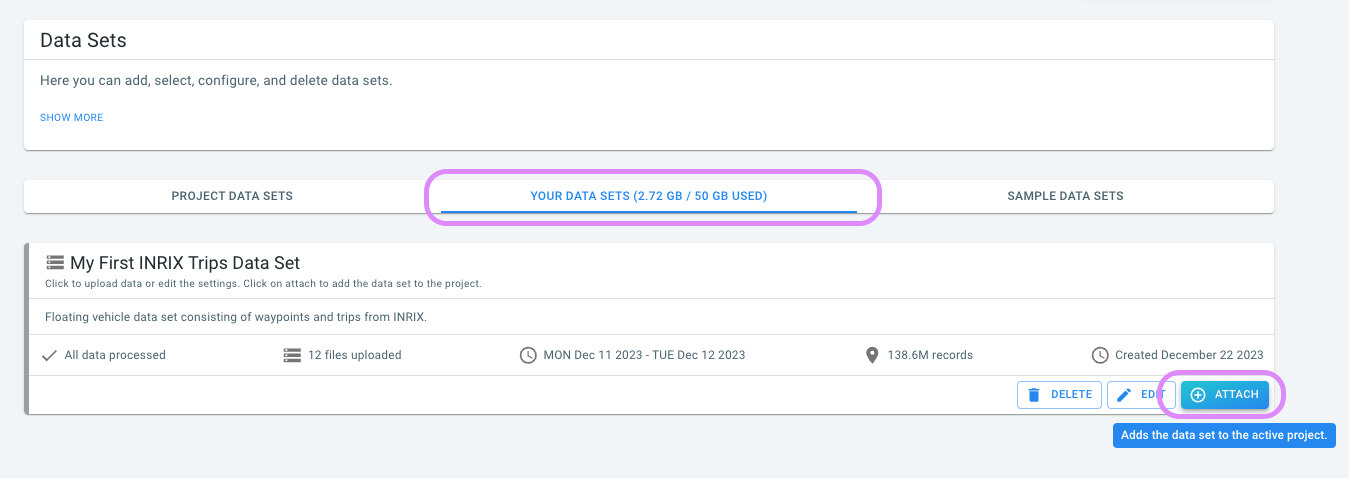 Figure 4. Attach your INRIX trips data set
From this point on the data set is part of the project.
| Data sets (and other resources) can be part of multiple projects. You can attach and detach data sets on the fly. However, keep in mind that detaching a data set can break already configured dashboards or bookmarks. |
Step 3: Attach a background layer
Let’s also add a Mapbox background layer to our project:
-
Click on Backgrounds on the navigation bar on the left
-
And click on the ADD BACKGROUND LAYER in the top right corner of the backgrounds page
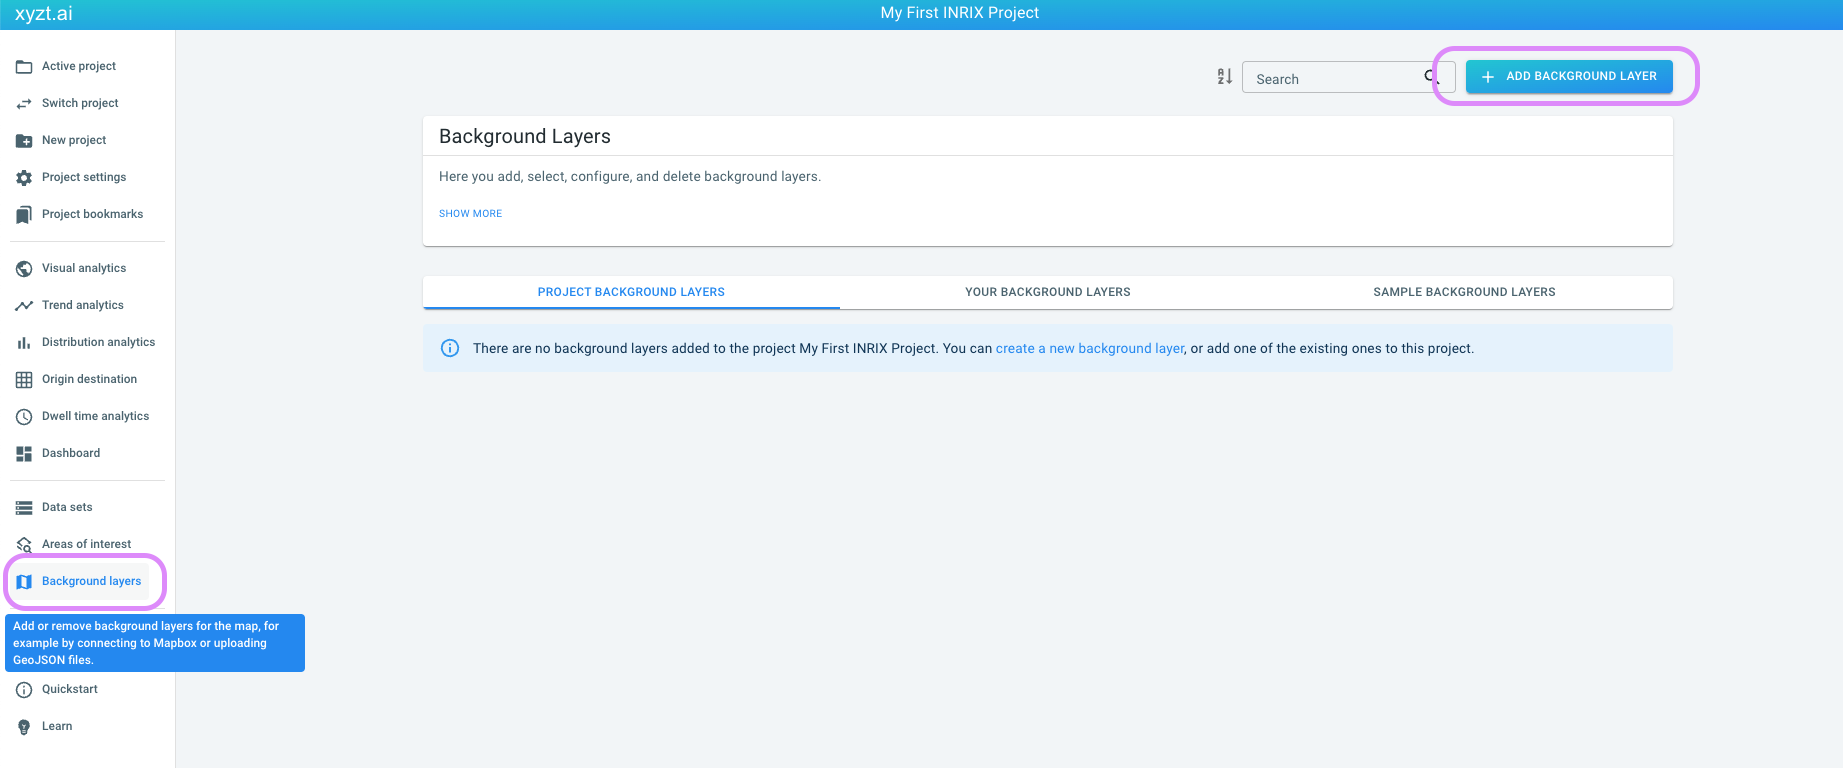 Figure 5. Attach a new background layer
 -
Let’s create a new Satellite & Labels Mapbox background layer
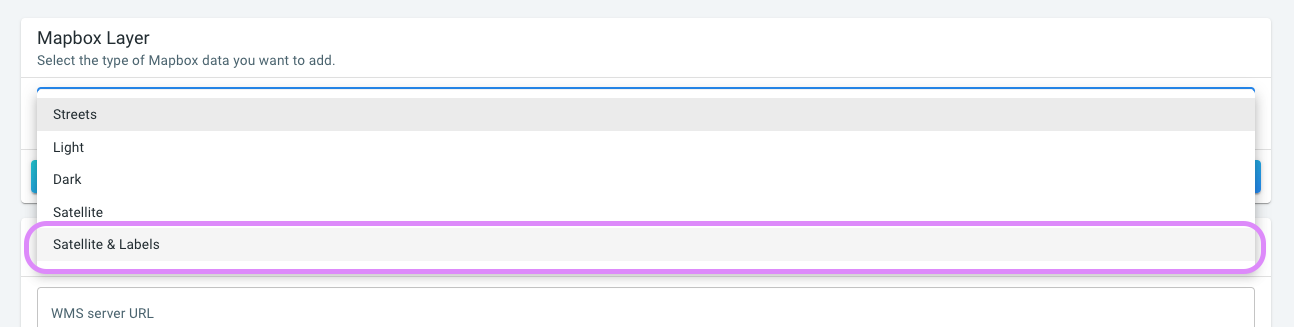 Figure 6. Create a new Mapbox background layer
 -
You can modify the layer name and then click on SAVE
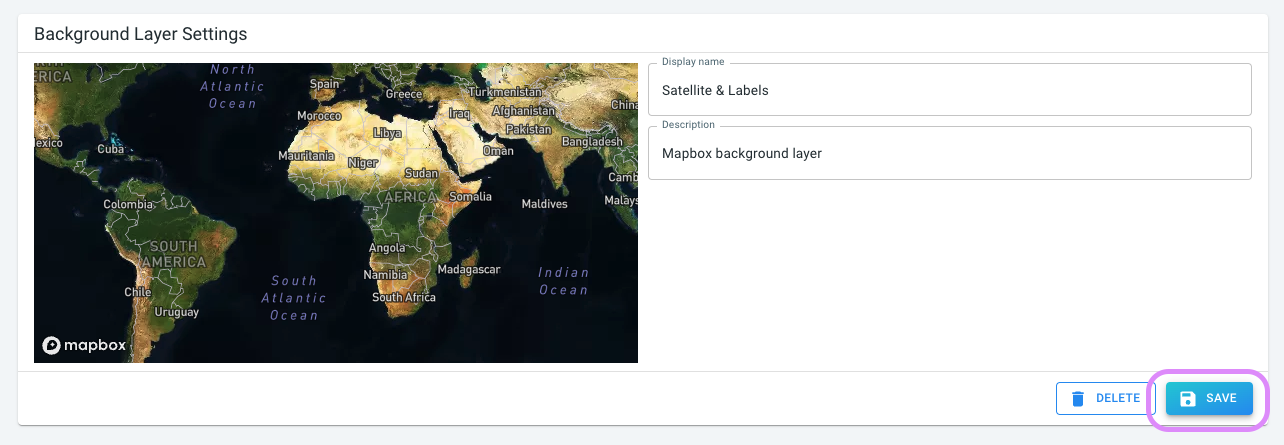 Figure 7. Saving the new Mapbox background layer
The newly created background layer is immediately attached to the active project.
Step 4: Open the visual analytics page
Now that you have created a new project, attached your data set and a background layer, you can start using it for visual traffic analysis:
-
Click on Visual analytics on the left navigation bar
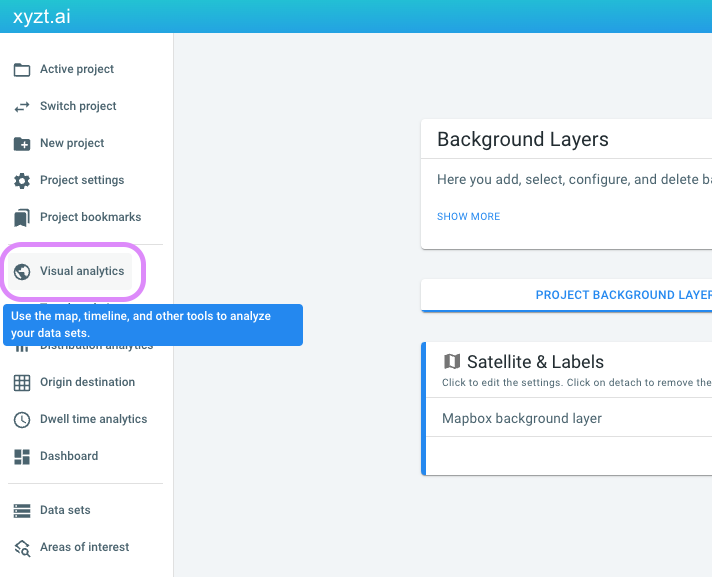 Figure 8. Opening the visual analytics page
 -
The visual analytics page opens with your data and the background layer.
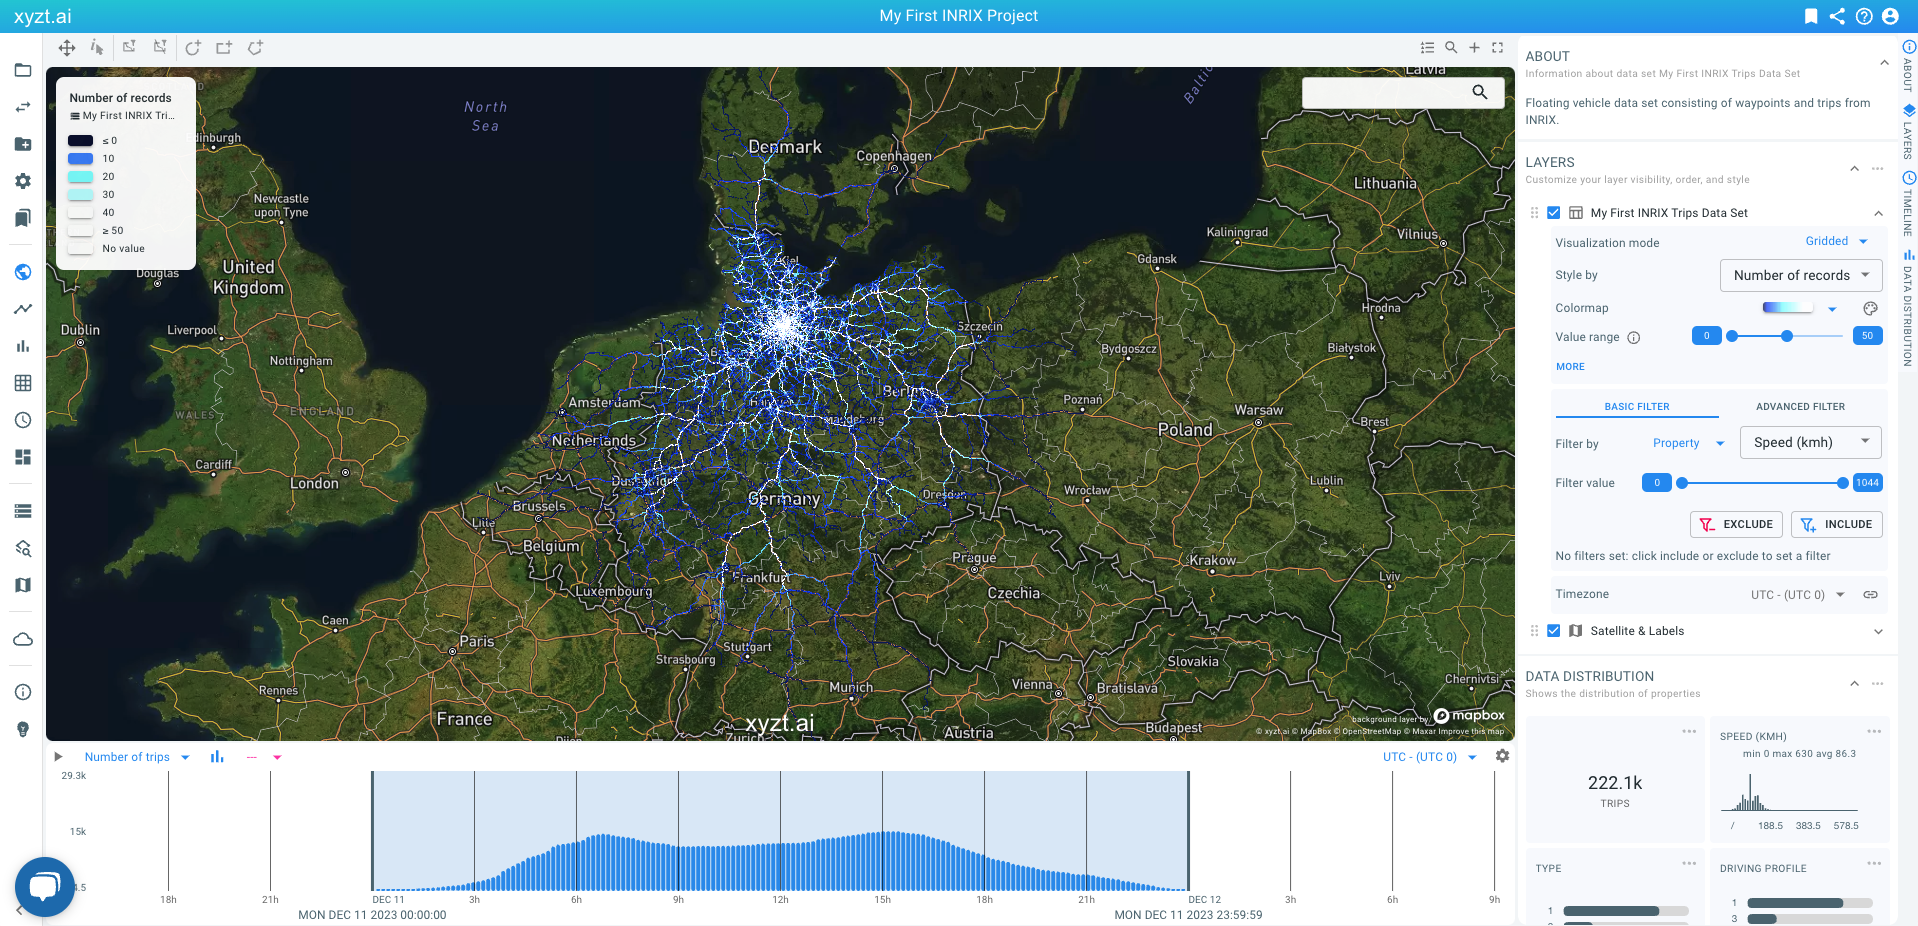 Figure 9. The visual analytics page with the INRIX trips data
Congrats! You succeeded in uploading your first INRIX trips data set. Good luck analyzing and don’t hesitate to reach out in case of questions.
Got feedback? Additional questions? Just want to have a friendly chat?
Get in touch!