gunzip trips.csv.gz
head trips.csv
Got feedback? Additional questions? Just want to have a friendly chat?
Get in touch!
Available parts
- Goal
- Step 0: Obtain data
- Step 1: Create the roads data set
- Step 2: Configure geometry properties
- Step 3: Upload the GeoJSON file
- Step 4: Define and upload a movement path data set (current)
- Further reading
Step 4: Define and upload a movement path data set
In the previous step you created the first data set with road segment data. Now you will create a second data set that contains trips along this road network.
Understanding movement path data
The trips are defined in the trips.csv.gz file. This is a gzipped CSV file for efficiency reasons.
If you are familiar with command line tools, you can unzip the file and inspect it for instance as follows (note that you do not need to unzip the file to complete the tutorial):
This gives following output:
TripID,Timestamp,Speed,VehicleType,GeometryID
id_0,2025-02-10 07:13:49,25.413329811971263,car,11405940_0
id_0,2025-02-10 07:13:51,39.76697196232885,car,11405940_1
id_0,2025-02-10 07:13:51,23.645093995029796,car,11405940_2
id_0,2025-02-10 07:14:13,43.08301345374769,car,11394244_0
id_0,2025-02-10 07:14:13,35.07116281792062,car,11394244_1
id_0,2025-02-10 07:14:14,33.58726373939426,car,11394244_2
id_0,2025-02-10 07:14:17,16.74187927430185,car,11394244_3
id_0,2025-02-10 07:14:24,39.436278809975285,car,11394244_4
id_0,2025-02-10 07:14:31,37.09103696800736,car,11394244_5
As you can see, the file contains the identifier of the trips, a timestamp, a speed property, a vehicle type property, and a geometry identifier.
The GeometryID corresponds to the unique identifier (segmentId) that was used before to uniquely identify the road segments in the roads.geojson.gz GeoJSON data set.
A trip, such as the trip id_0 consists of multiple rows in the CSV file, where each row corresponds to the time that the vehicle was at the referenced road segment. The temporal sequence of road segments constitutes a single trip.
|
Movement path data is an extremely powerful data source for traffic analysts. The xyzt.ai platform does not pre-aggregate the individual trips, but instead allows fine-grained filtering and analysis enabling analysts to extract virtually any information such as traffic densities, speed profiles, and even traffic flow patterns. |
Creating a movement path data set
Follow these steps to create a new movement path data set:
-
Click on Data sets on the navigation panel on the left
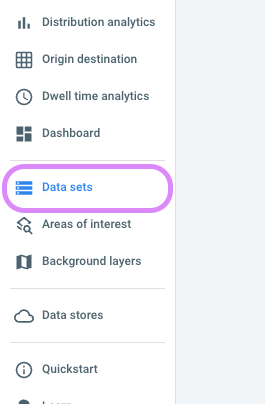 Figure 1. Navigate to the data sets page.
 -
Click on CREATE NEW DATA SET in the top-right corner
-
Fill in the form as follows:
-
Name:
Trips -
Data type:
Movement Path Data -
Leave the data and metadata file types to CSV
-
Describe what is moving:
trips -
You can leave the description empty
-
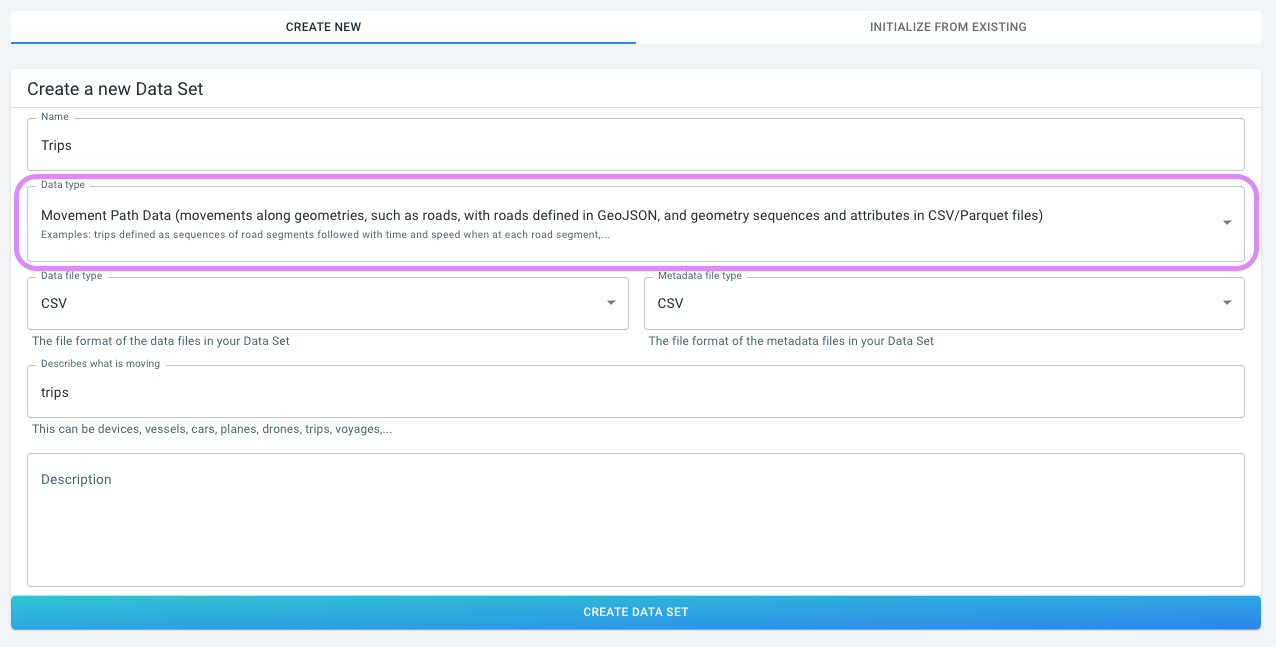
Figure 2. Creating a new movement path data set.
Click on CREATE DATA SET.
This will bring you to the multi-step process to further configure the data set.
Configuring a movement path data set
The first step in configuring the movement path data set is to select the road network data set that it depends on. This is the Road segments Portland, Maine data set that we created before.
-
In the Select Geometry step click on the drop-down box and select
Road segments Porland, Maine.
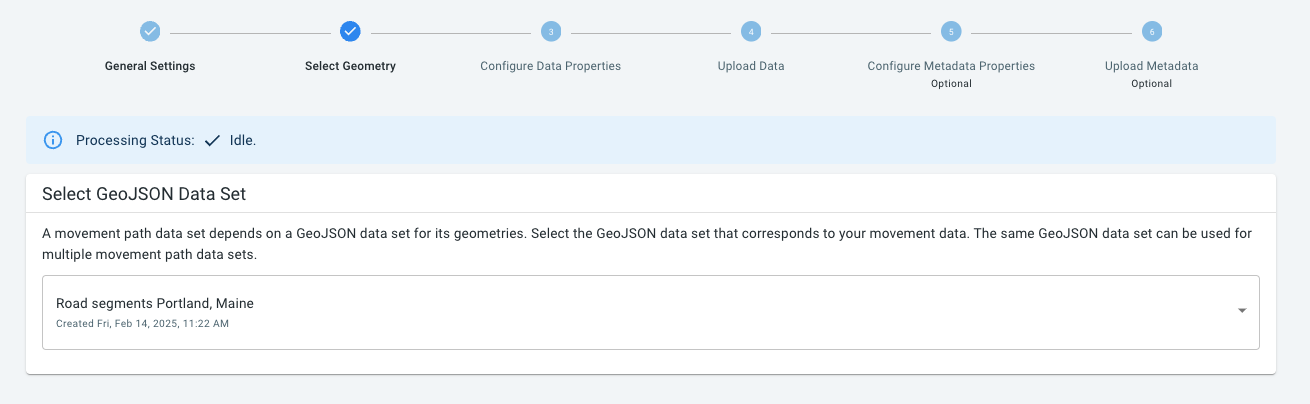
Figure 3. Selecting the road network data set.
Go to step 3, by clicking on Configure Data Properties at the top of the page.
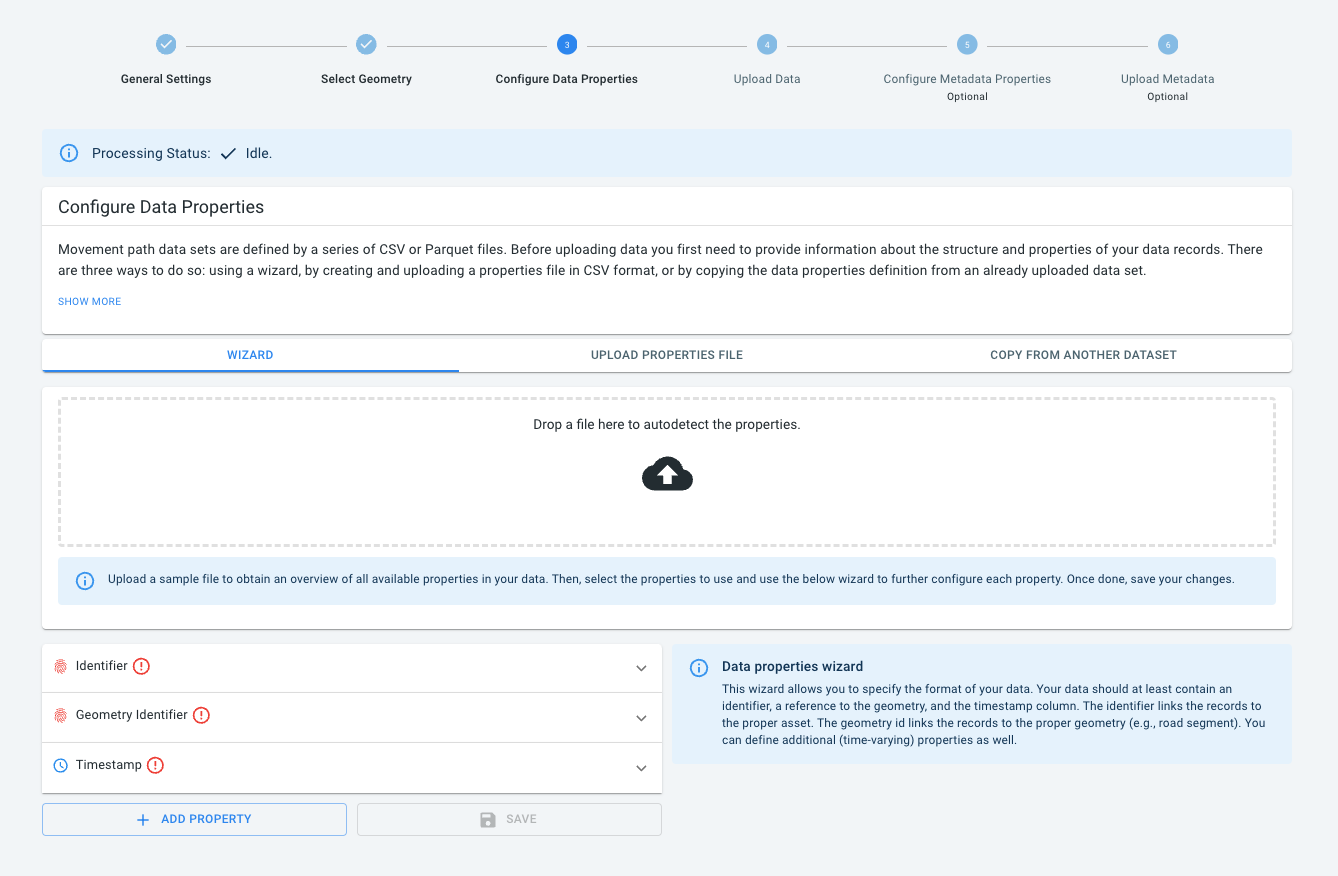
Figure 4. Step 3: Configure Data Properties
As you can see in the wizard, there are 3 red exclamation marks. They indicate that we should at least define:
-
An Identifier, i.e., the column with the trip IDs.
-
A Geometry Identifier., i.e., the column with the road segment IDs.
-
A Timestamp, i.e., the column with the times at which the trip passes on the different road segments.
In addition, we can enable additional properties such as the Speed and Vehicle Type properties.
You can follow the same process as before, by uploading the trips.csv.gz to the Wizard’s drop-box to autodetect the properties and further configure them. Instead, we are going to use a data properties csv file that was pre-configured for this type of data:
-
Open The trips data properties file and save it to disk.
When the file opens in the browser, you should see following content:
TripID,id:string,,true,,,,
Timestamp,time,The timestamp at which the location was recorded,false,,,,
Speed,double,,true,1,,,
VehicleType,enum,,true,,,,
GeometryID,geometryId:string,,true,,,,
For every column in the trips.csv.gz file, it defines how the platform should use the data:
-
Column 1: TripID is the identifier, it is a
string -
Column 2: This is the timestamp
-
Column 3: This is a custom property named Speed, it’s a numeric that will be used with accuracy 1 (meaning values will be rounded down to the nearest integer)
-
Column 4: VehicleType is an enum, meaning it has a limited set of possible values (in this case,
car,truck, andlcsv) -
Column 5: This is the geometry identifier, referring to the road segments. This is denoted using the
geometryId:pre-fix.
Now click on UPLOAD PROPERTIES FILE and locate the trips_properties.csv file and drop it on the drop-box.
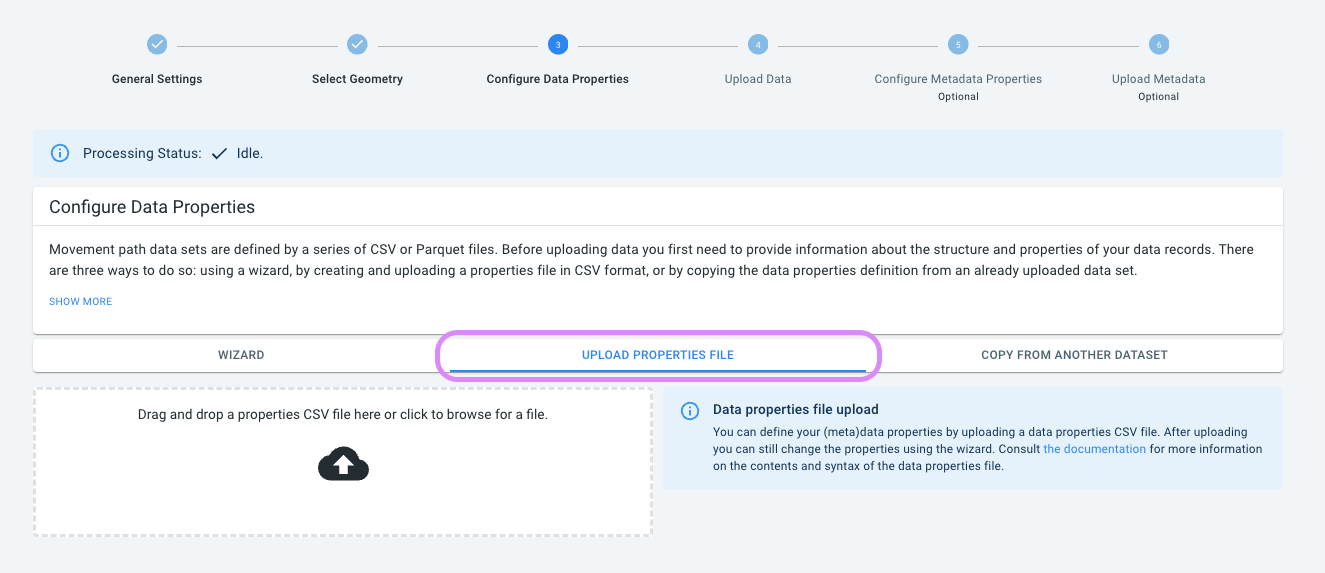
Figure 5. Uploading the data properties file to configure the data properties.
You should now see a table at the bottom of this page summarizing the configured properties:
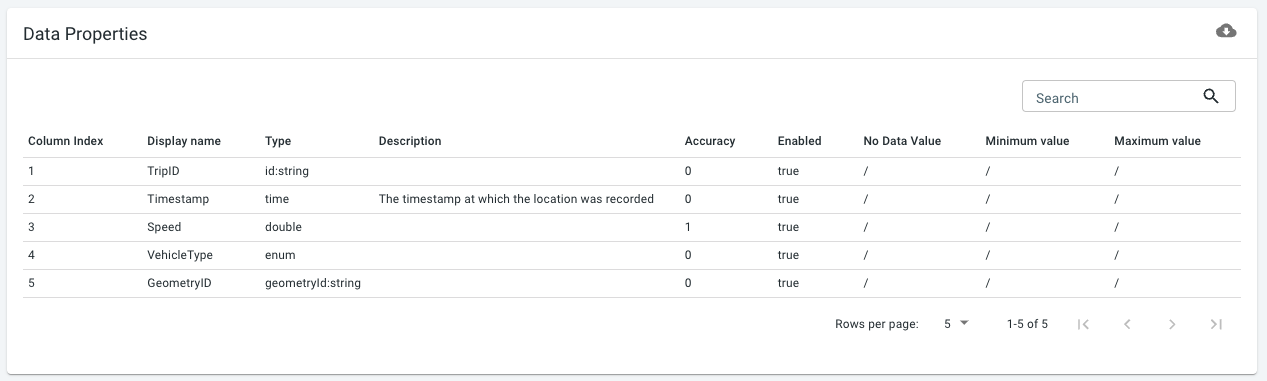
Figure 6. Table summarizing the configured properties.
Click on Wizard and notice how the different columns are also configured in the wizard:
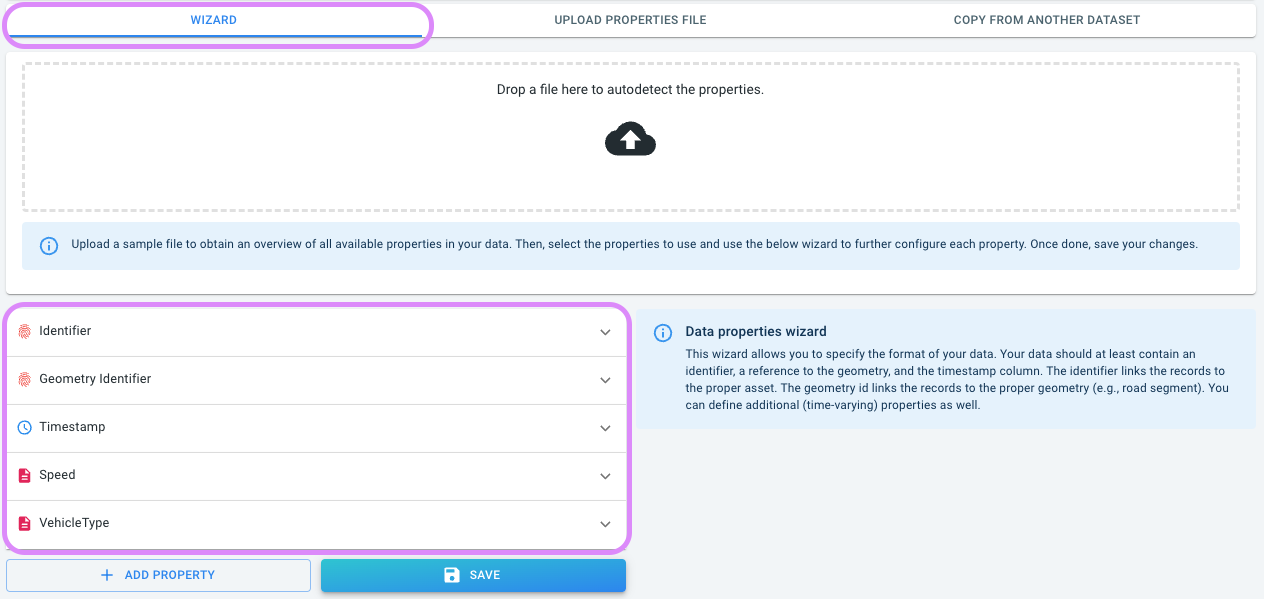
Figure 7. The wizard also displays the configured properties.
You now have fully configured the movement path data set. In the next step you will upload the actual trips data to the platform.
Uploading movement path data files
In this final step, you upload the trips.csv.gz file as follows:
-
Click on Upload Data, which is step 4 in the stepper at the top of the page.
-
Drop the
trips.csv.gzfile on the drop-box.
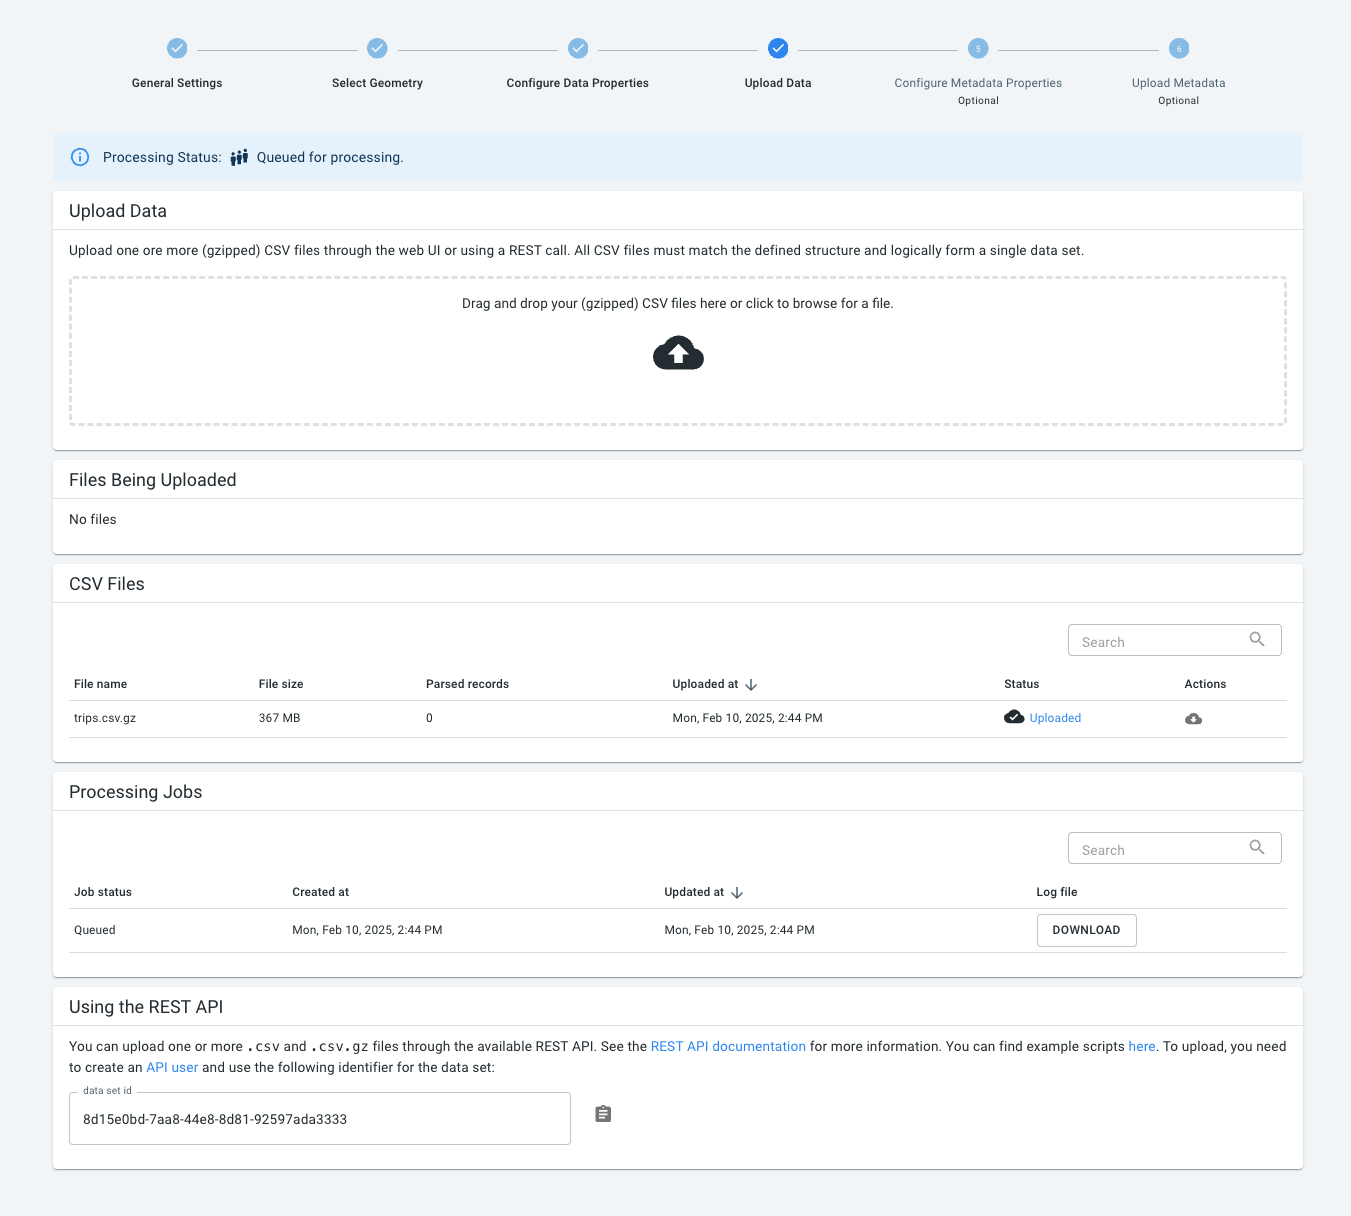
Figure 8. Uploading
trips.csv.gz.The file should be listed after upload in the CSV Files table and the status should soon become Processing. Processing this 367MB file can take some minutes.
Visually analyzing movement path data
Wait until the data is fully processed.
Once finished, let’s go to the project’s data sets page by clicking on Data sets on the left side on the navigation bar.
You should now see that there are two data sets attached to the project:
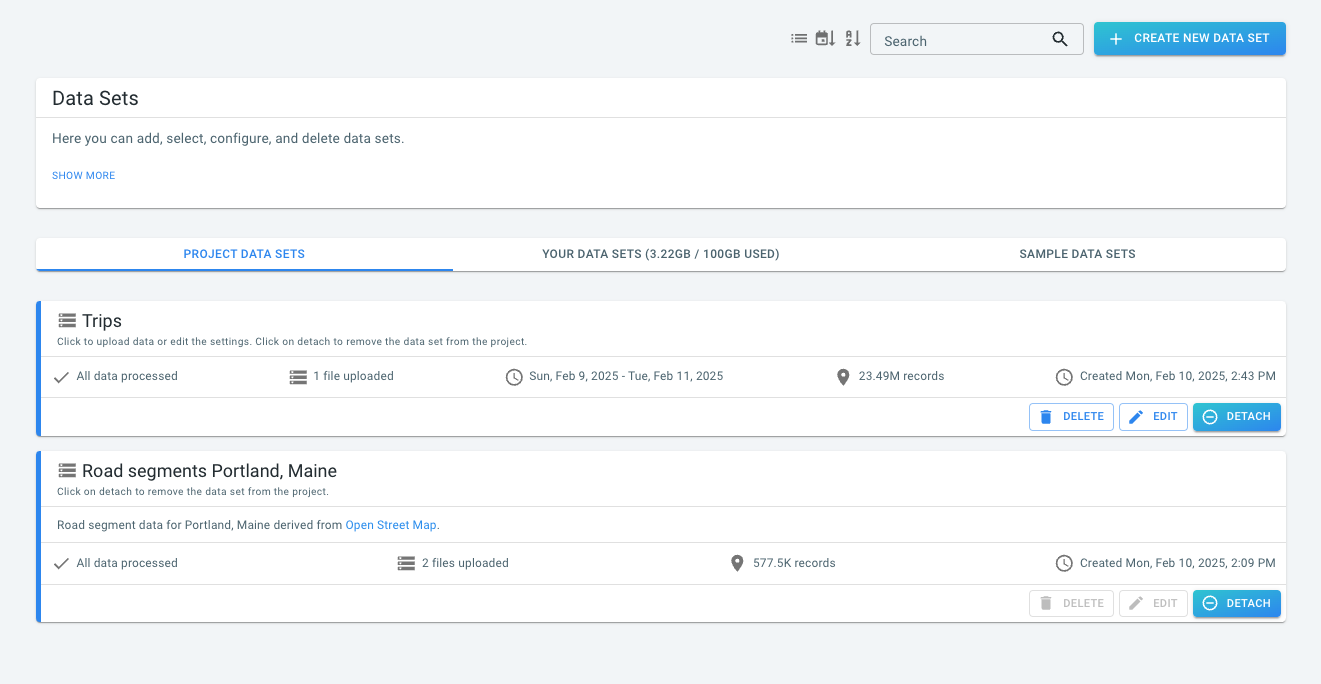
Figure 9. The two data sets part of the project.
-
Trips: the movement path data set
-
Road segments Portland, Maine: the GeoJSON data set with the road segments
Let’s detach the latter by clicking on its DETACH button. This way only the Trips data set will remain available in the project.
Now click on Visual analytics on the left side of the screen.
Depending on whether you had attached a background layer to the project before, you should now see a density map on an empty background or a density map on the background layer.
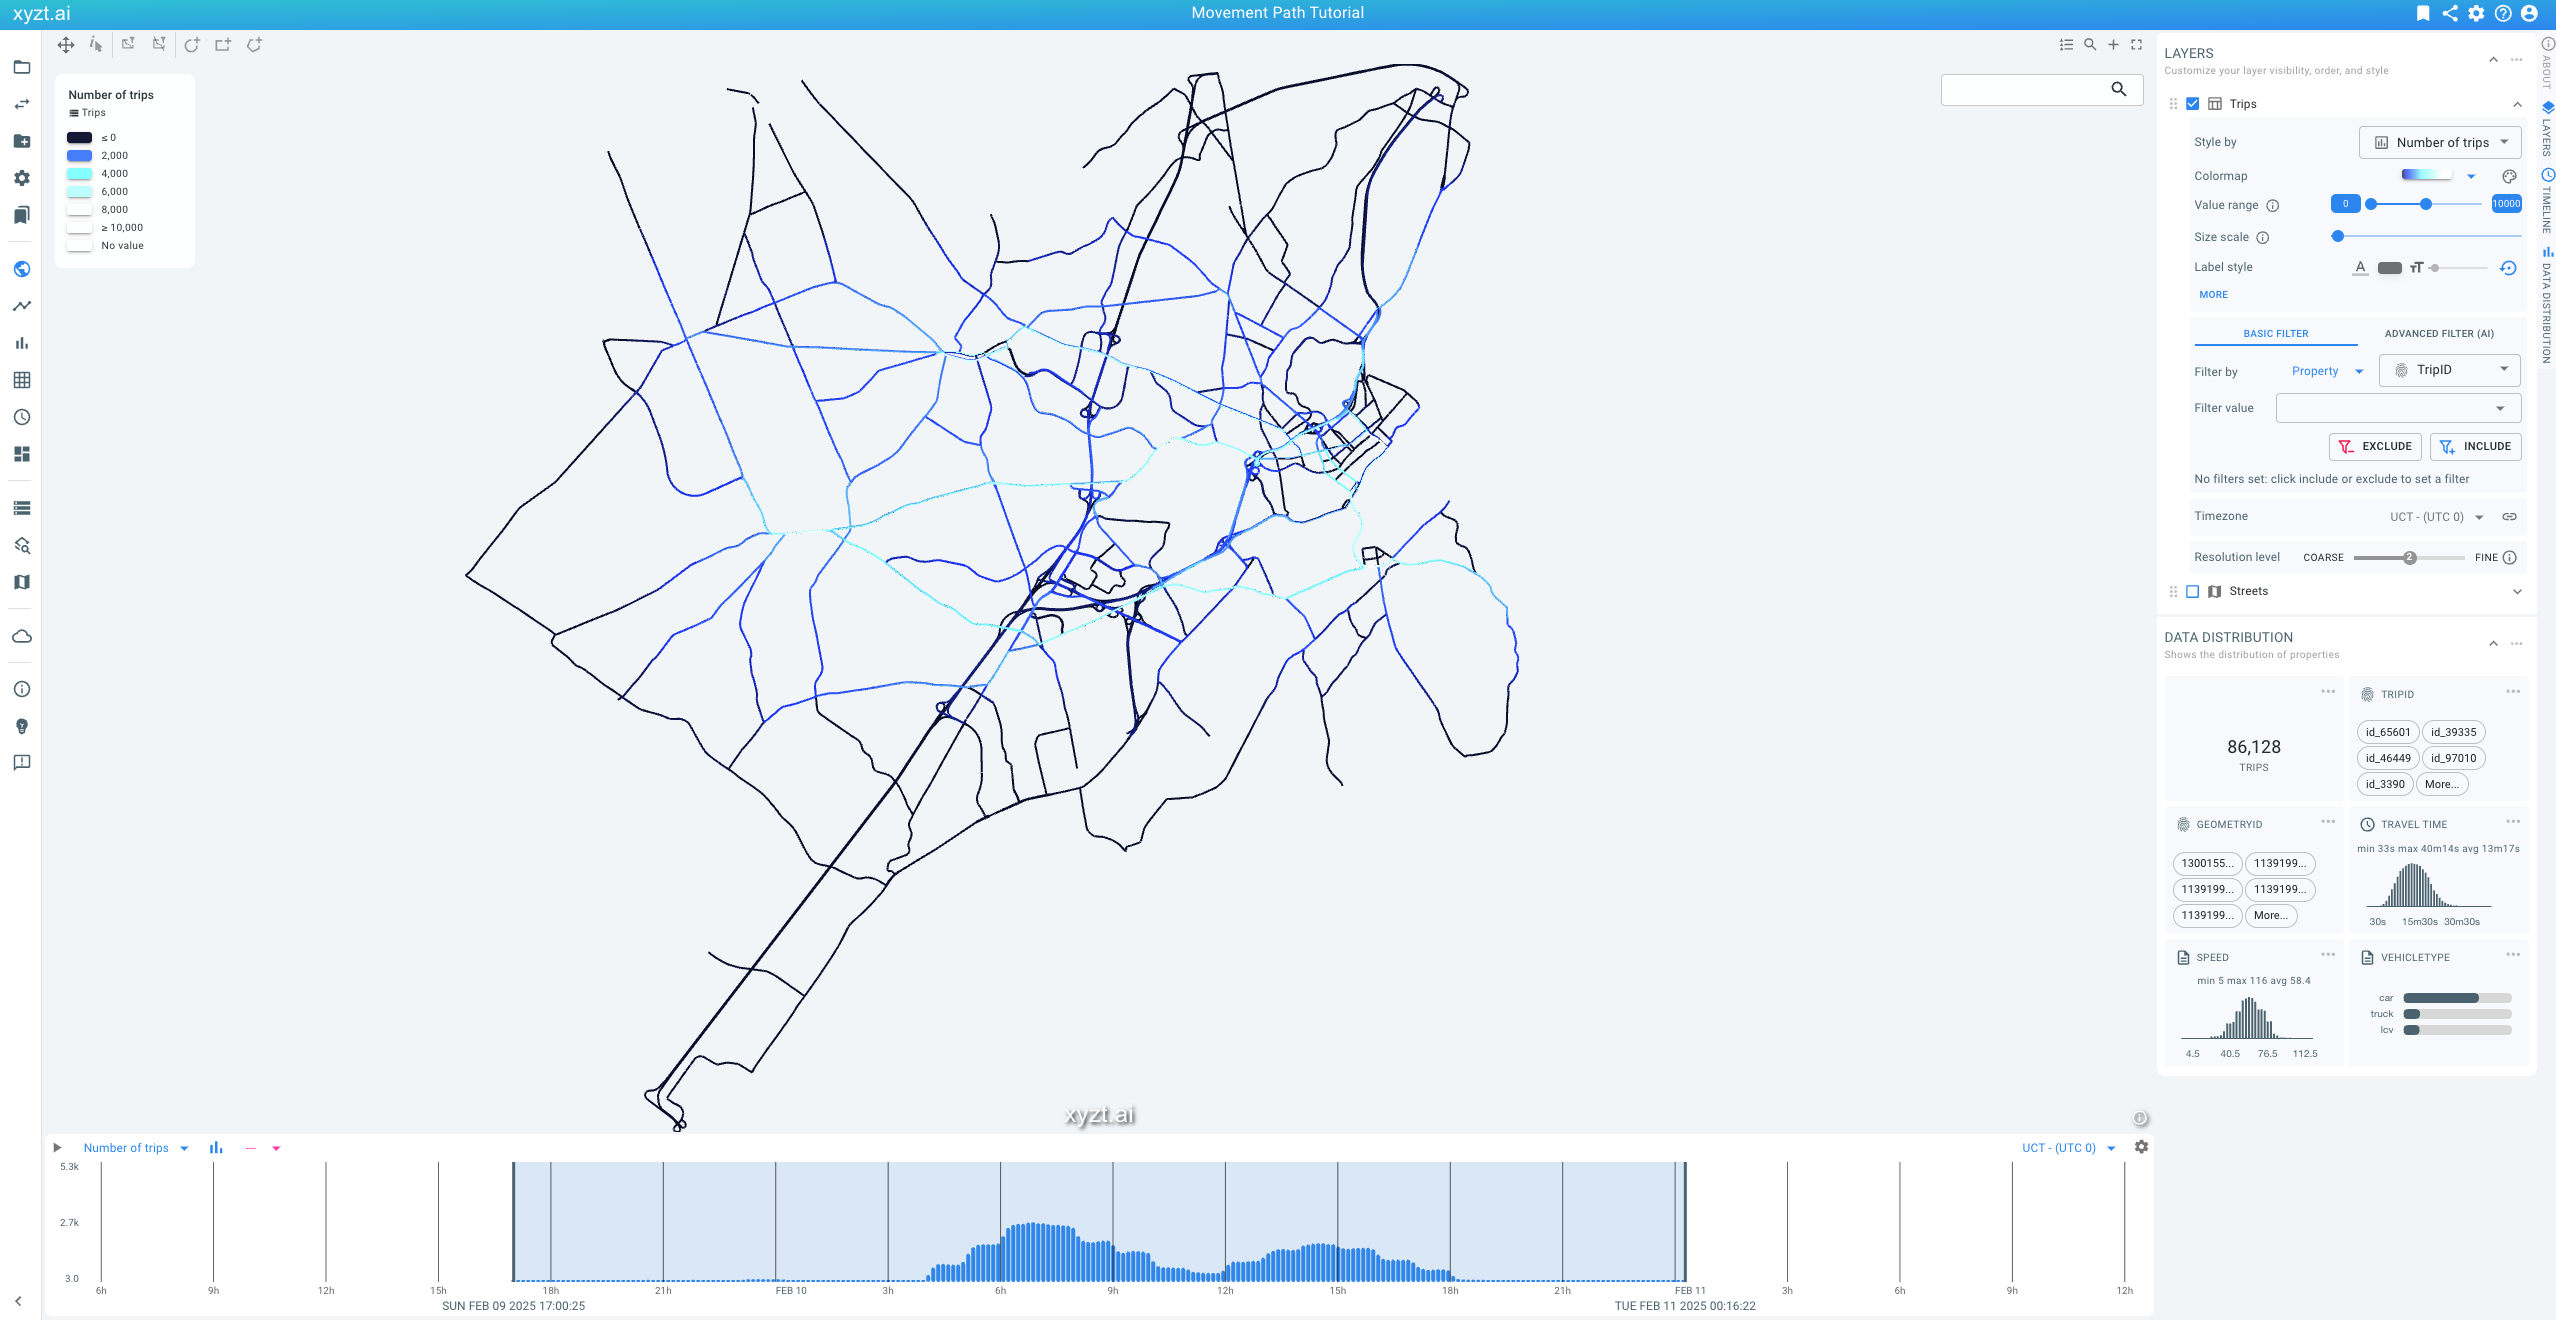
Figure 10. Density map of the movement path data.
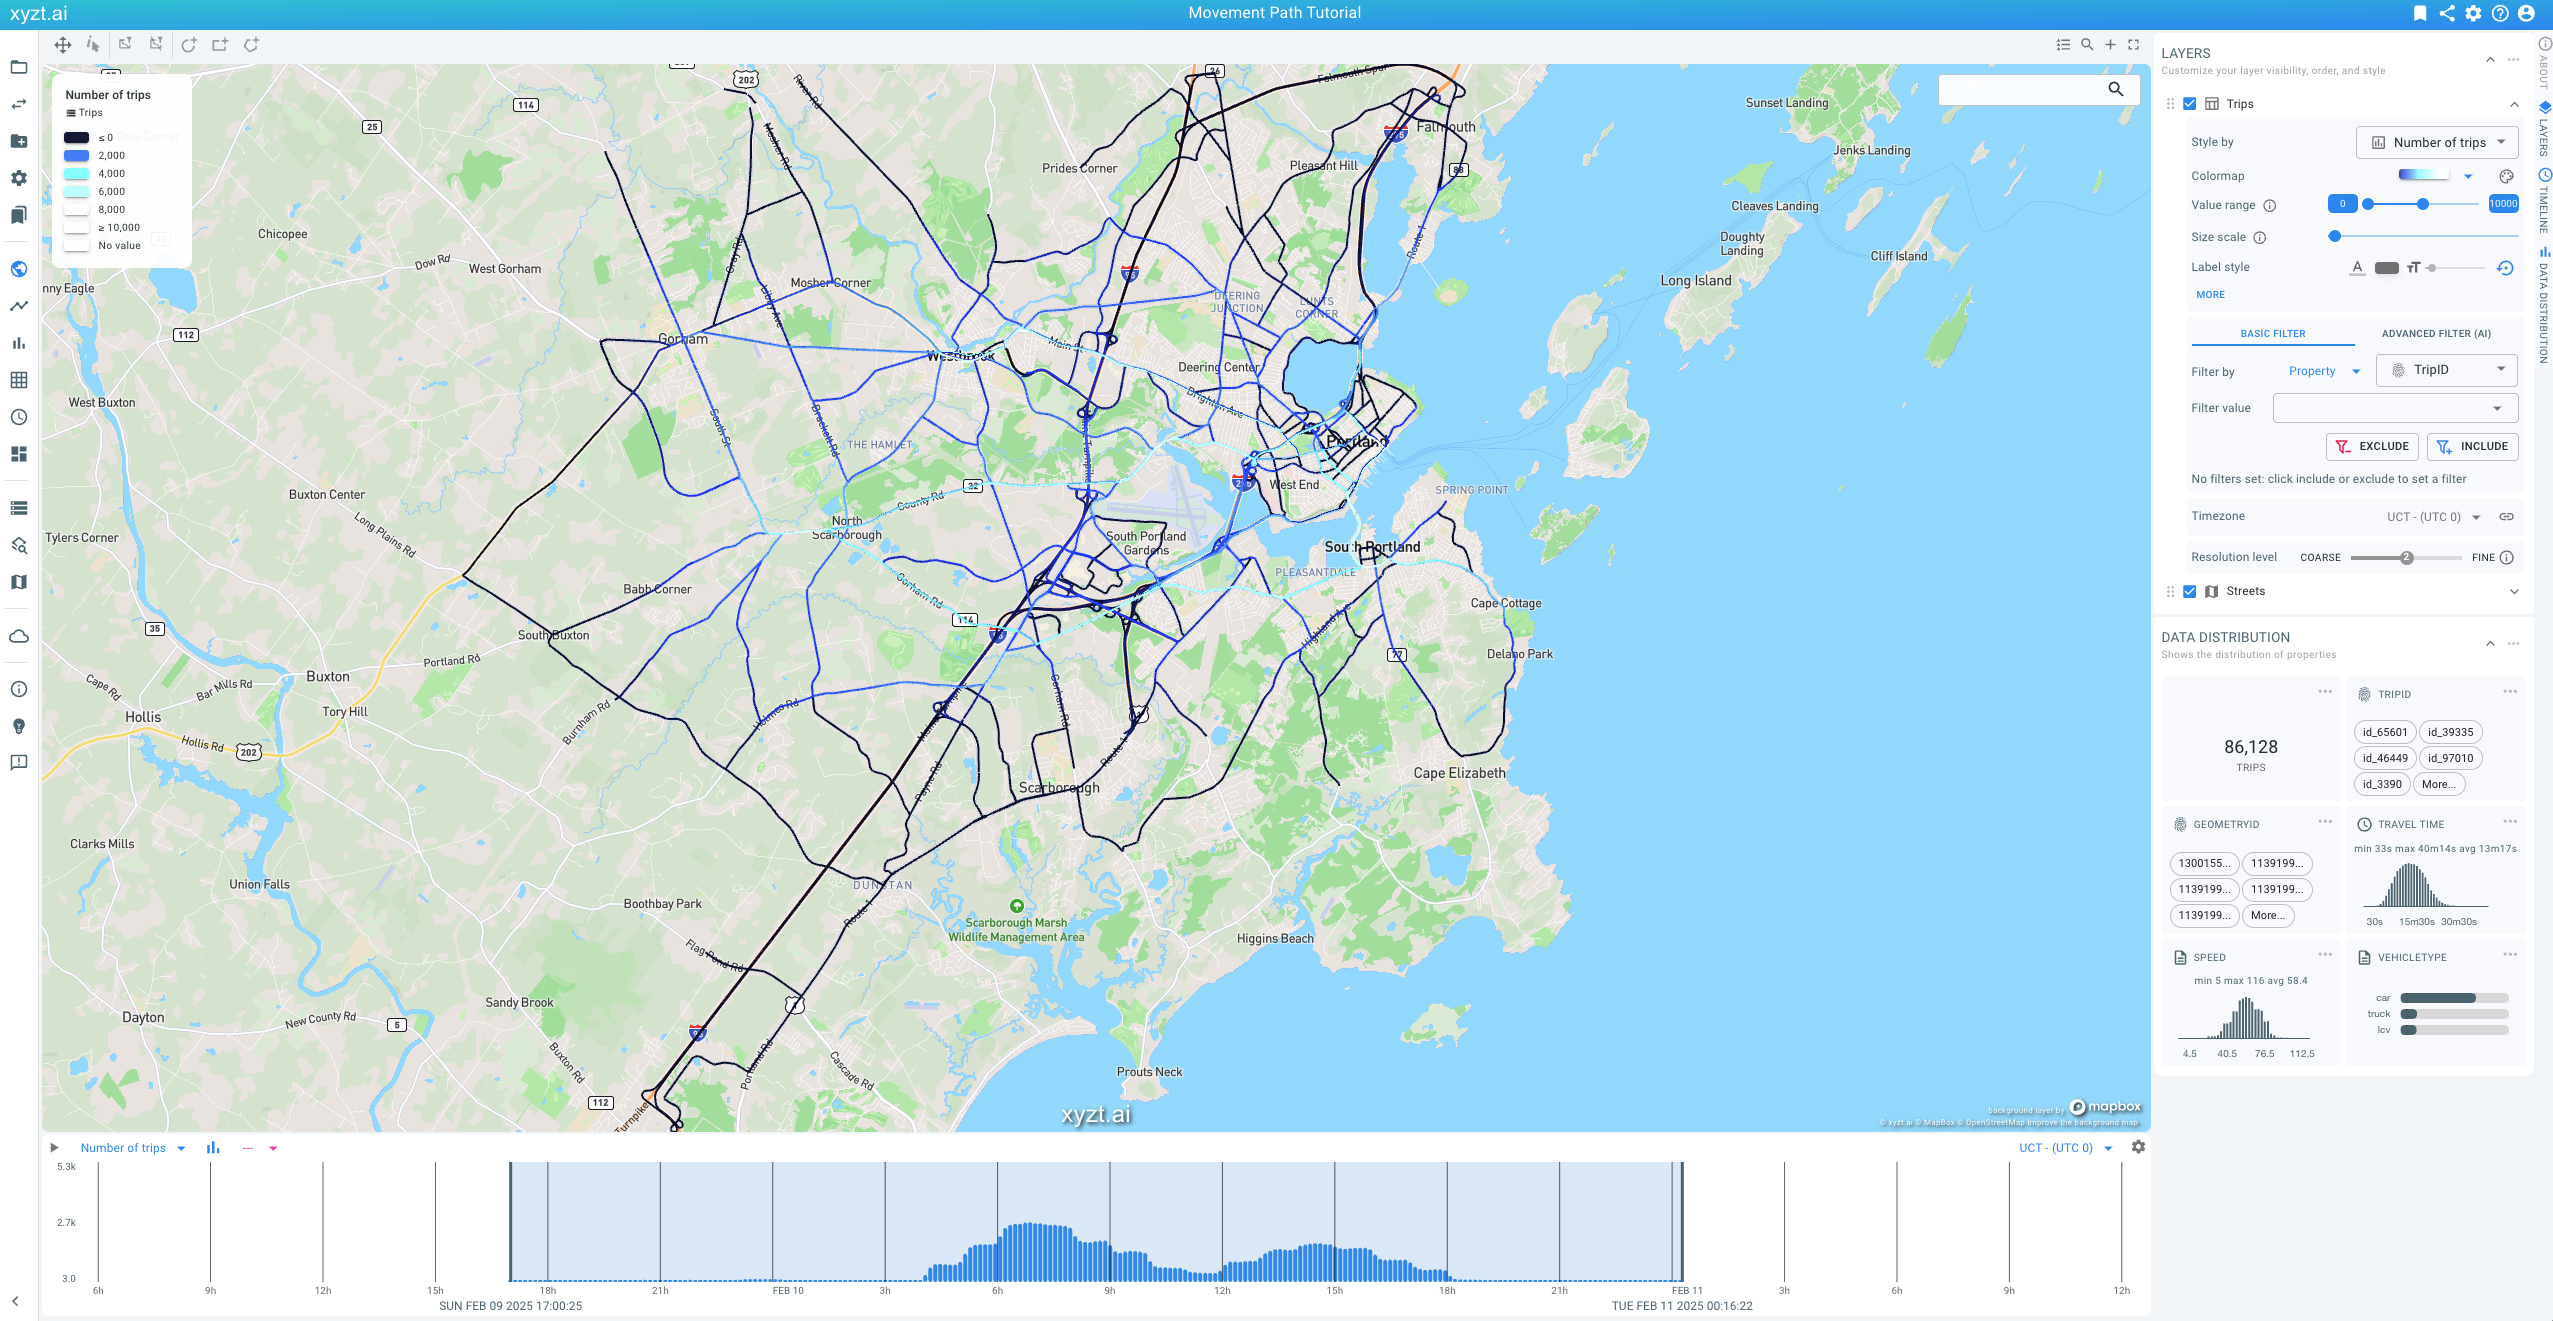
Figure 11. Density map of the movement path data with a background layer.
The density map shows the road segments visualized by number of trips.
Start performing your first analysis:
-
Zoom in on the center area of Portland
-
Select Style by
Speed -
Change the Value range to 5→60
-
Increase the Size scale
Notice how the road segments are now colored by average speed and that two-way roads can have different speed values in each direction.
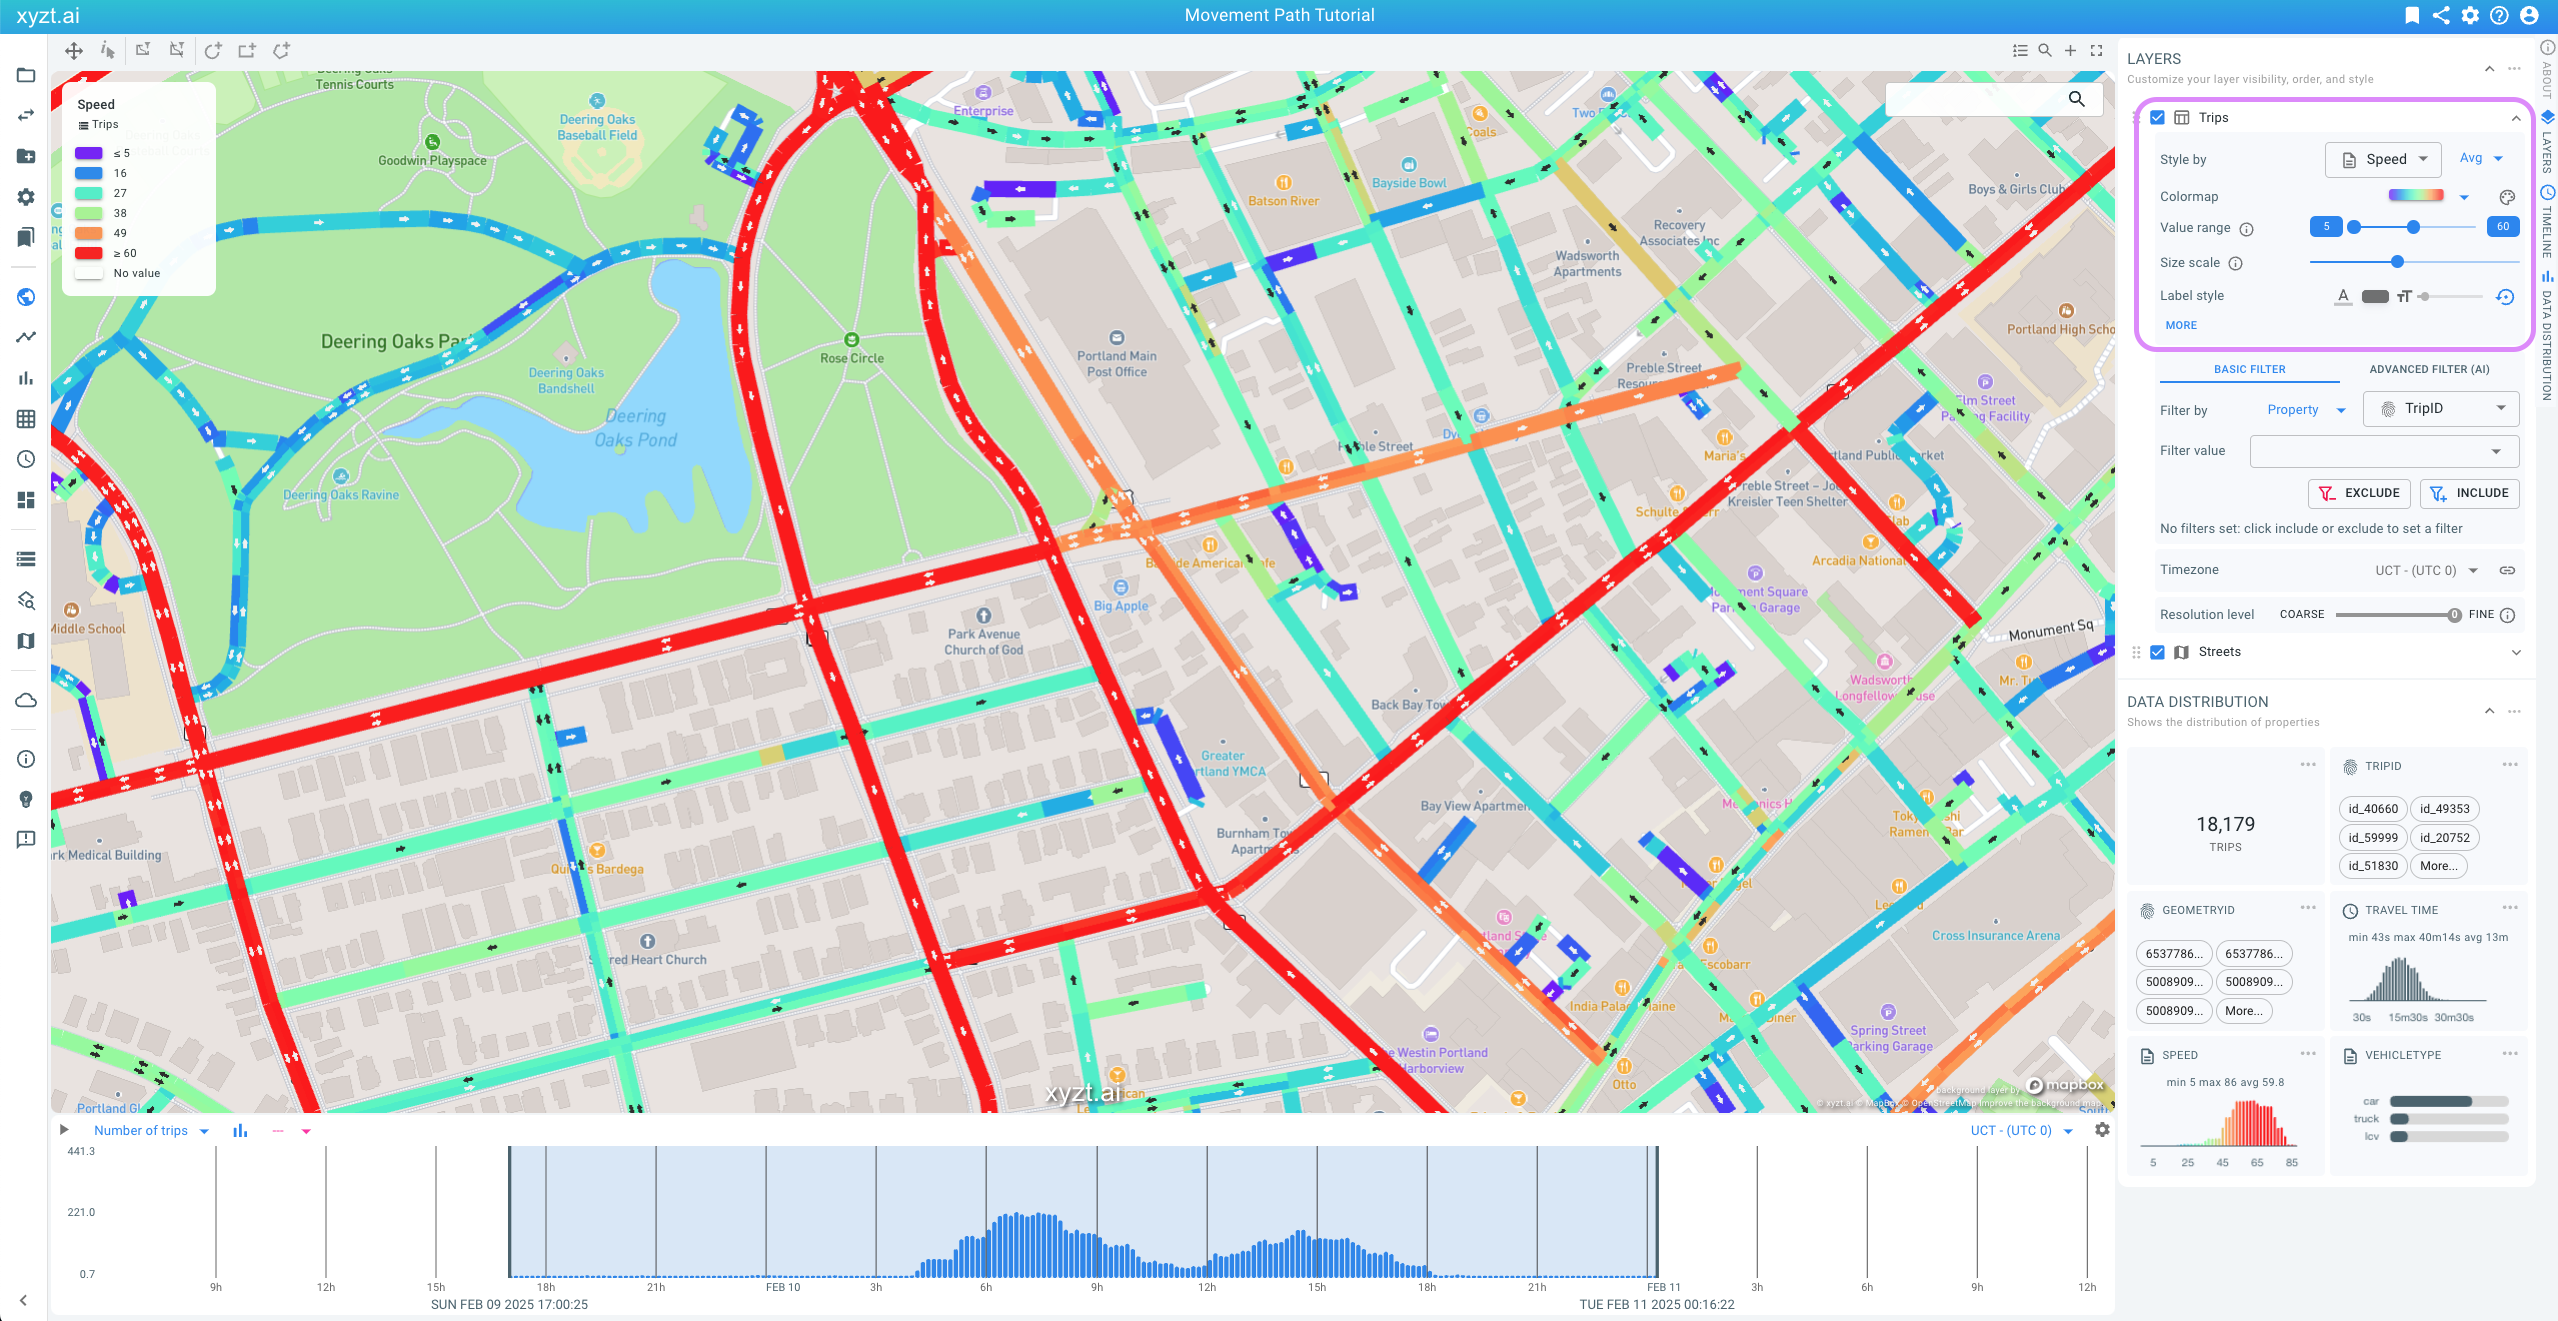
Figure 12. Changing styling to see average speed on the road segments.
Congrats! You managed to create a first GeoJSON data set with a road network, and a first movement path data set with trips of vehicles on that road network.
|
In this tutorial, we did not use metadata. Metadata is data that does not change over time for a trip. You can define such constant trip properties separately, for instance in a Moving constant properties to separate metadata files has the advantage that the |
Next part
Go to the next part: Further reading
Got feedback? Additional questions? Just want to have a friendly chat?
Get in touch!