Got feedback? Additional questions? Just want to have a friendly chat?
Get in touch!
Available parts
- Goal
- Step 0: Obtain data
- Step 1: Create the roads data set (current)
- Step 2: Configure geometry properties
- Step 3: Upload the GeoJSON file
- Step 4: Define and upload a movement path data set
- Further reading
Step 1: Create a new data set
What is a data set?
When you upload data files (such as .geojson or .geojson.gz files) to the platform, we will store them in something that is called a data set.
Multiple data files can be added to the same data set.
You can have multiple data sets as well, for example:
-
One collection where the data file(s) contain the road segments
-
One collection where the data file(s) contain trips along those road segments
See this article for more information about data sets.
|
You can upload both
.geojson and .geojson.gz filesThe platform also accepts gzipped files. This enables you to first compress each individual file before uploading them to the platform, saving storage and upload time. Each file needs to be zipped individually. |
In this tutorial, we will create two data sets. But let’s first create a project.
Step 1.1: Create a project
A project combines the resources such as data sets and background layers that you need to perform your analysis.
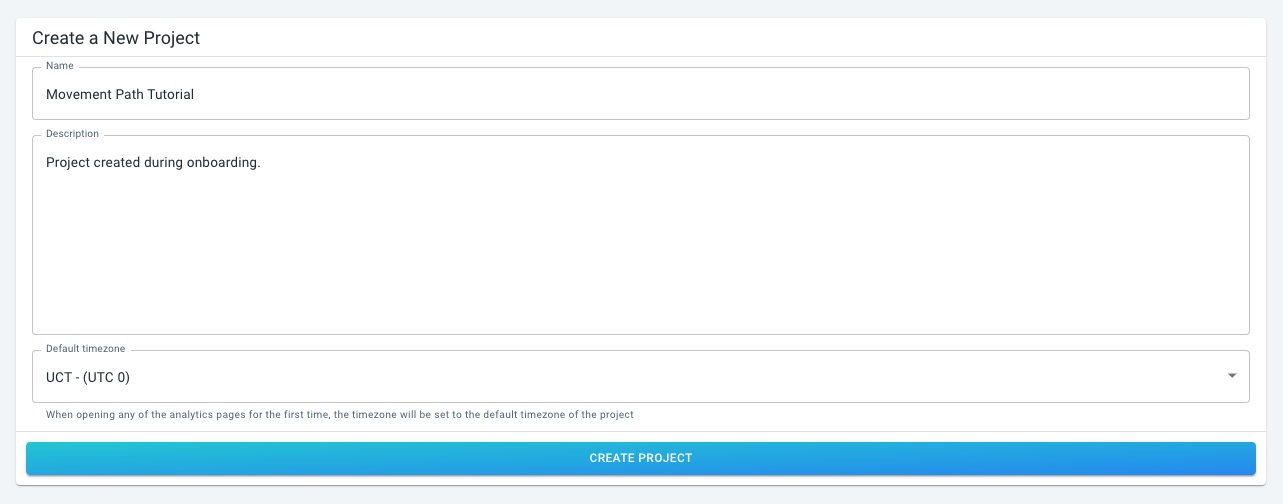
Create a new project by clicking on the New Project button in the left navigation bar.
Fill in the form as follows:
-
Name: Movement Path Tutorial
-
Description: Project created during onboarding.
-
Default timezone: Select UTC
Figure 1. Create a project to work with the data sets.
Click on CREATE PROJECT.
The new project is now the active one, and the data sets that we create will be automatically added to the project.
Let’s first create the GeoJSON data set with the roads.
Step 1.2: Navigate to the 'New data set' page
Click on the Data sets button in the left navigation bar.
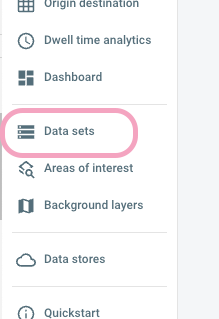
Figure 2. Navigate to the data sets page by clicking on the button on the left.
Now click on the CREATE NEW DATA SET button in the top right corner of the Data sets overview page.
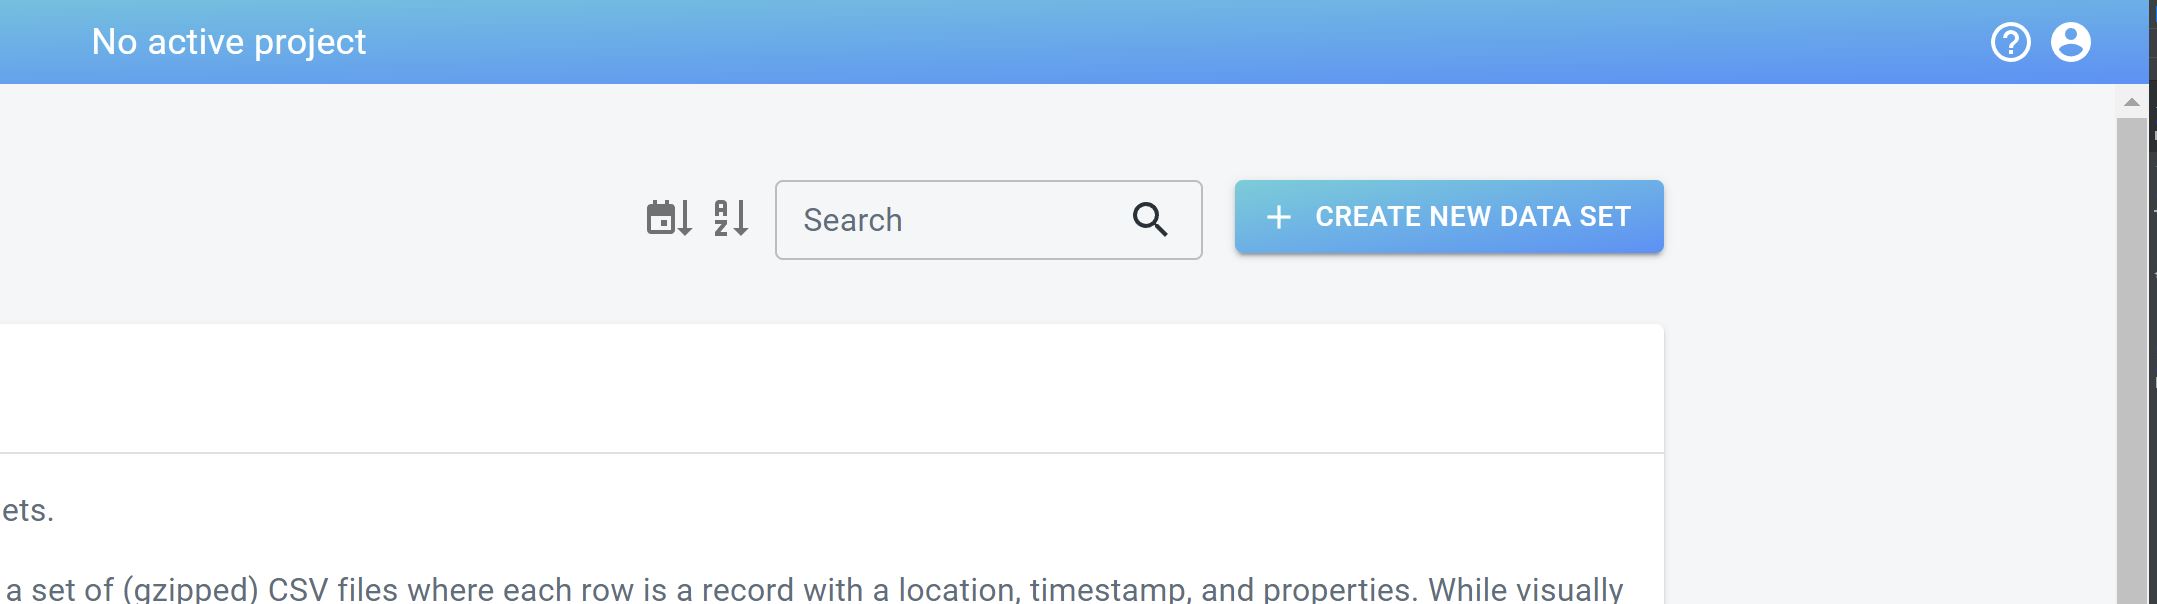
Figure 3. Create a new data set using the button in the top-right corner of the data sets page.
Step 1.3: Define your data set including the name, data type, and description
Fill in the form to provide a name and description for your data set, for example:
-
Name:
Road segments Portland, Maine -
Data type: Choose Geometry Data
-
Geometry file type: Leave at GeoJSON
-
Describes what your shapes represent: Here you describe what exactly the shapes in the GeoJSON data are. In this case use
segments. As the data from this tutorial contains segments of roads. This name will be displayed in the UI elements of the different analytics pages, such as the Visual analytics page. -
Description:
Road segment data for Portland, Maine derived from <a href="https://www.openstreetmap.org/">Open Street Map</a>.Note how you can use HTML tags to improve the description.
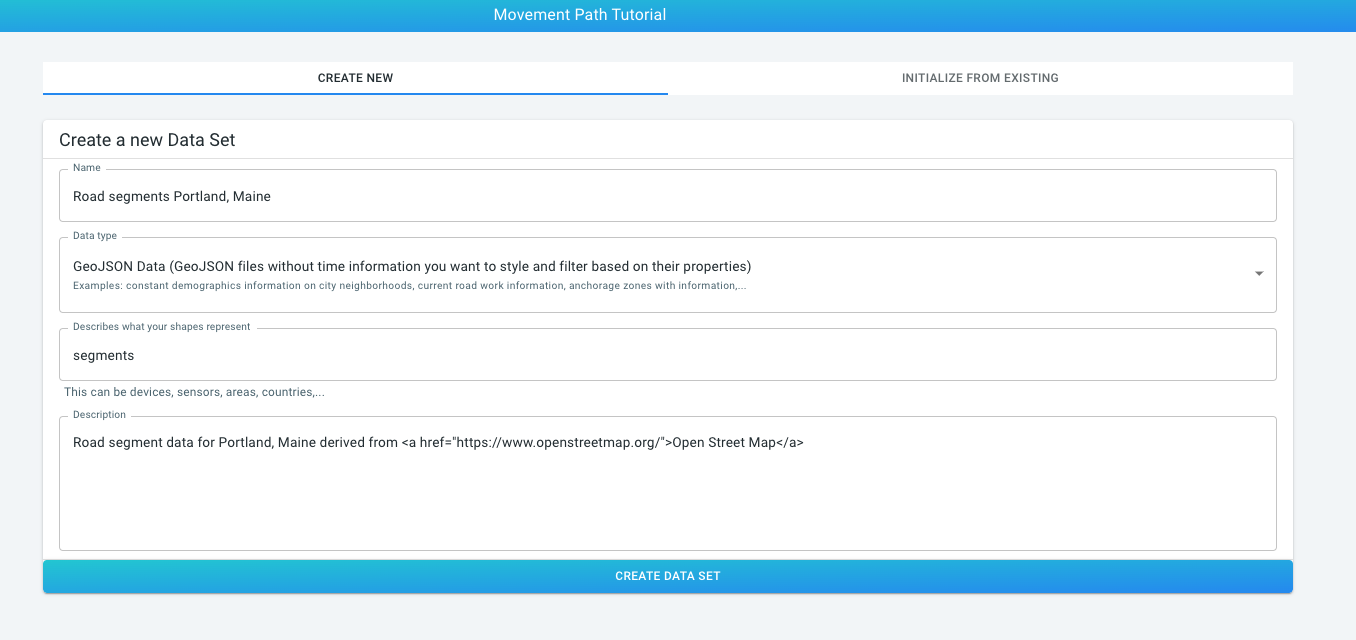 Figure 4. The completed form to create the data set.
Once you filled in everything, press the CREATE DATA SET button.
This will bring you to the multi-step page where you need to provide all other required information.
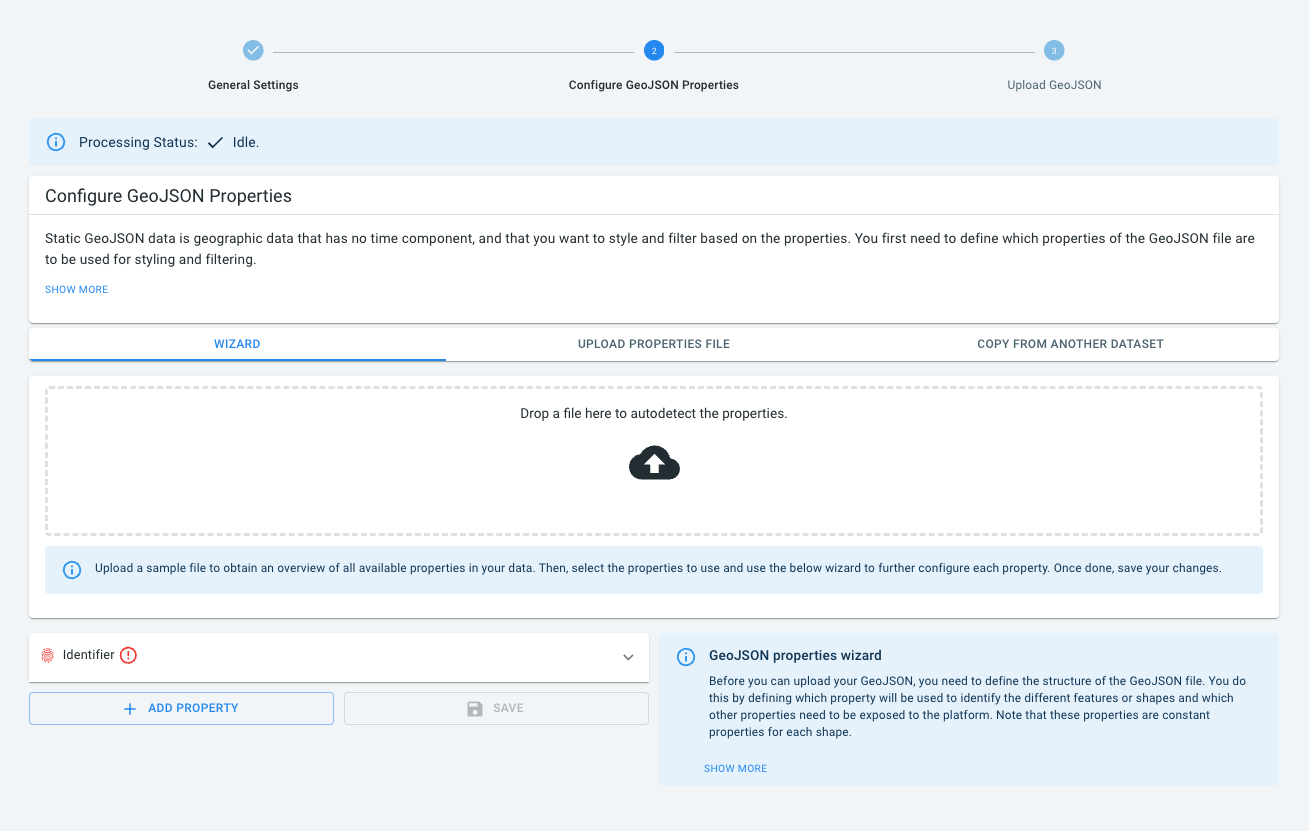
Figure 5. After creating the empty data set, you get redirected to this page.
Each of the steps you will need to do next is represented by an item in the navigation bar at the top of the page.

Figure 6. The navigation bar, currently positioned at the "Configure data properties" step.
You see that the first step "General Settings" is already completed. If you click on it, a page opens where you can adjust the name, description that we just filled in.
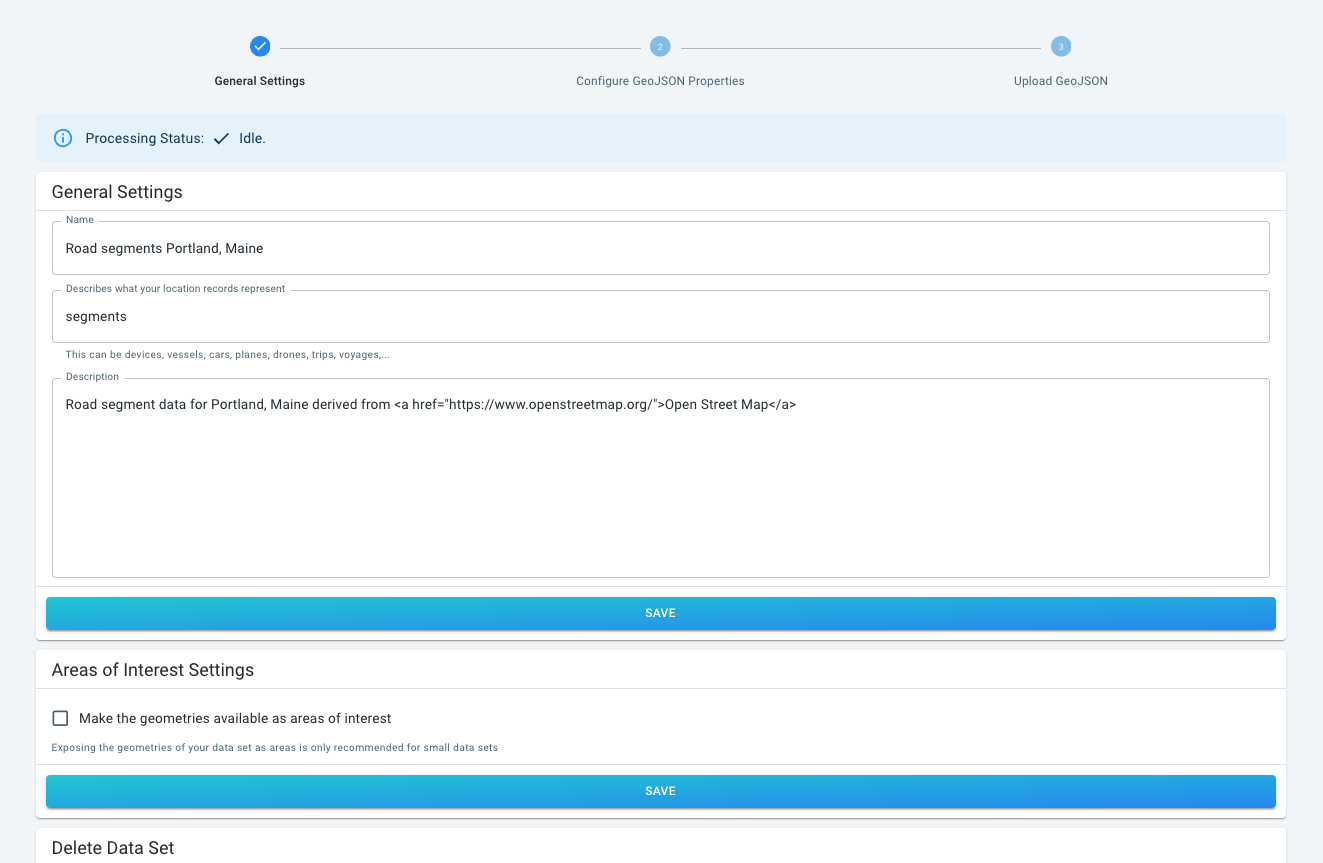
Figure 7. The navigation bar after clicking on the General settings button.
Clicking on the different steps in the navigation bar on the top allows you to go back and forth, or do the steps out-of-order. Steps that are not possible to complete before another will be disabled.
Next part
Go to the next part: Step 2: Configure geometry properties
Got feedback? Additional questions? Just want to have a friendly chat?
Get in touch!