Got feedback? Additional questions? Just want to have a friendly chat?
Get in touch!
Available parts
- Goal
- Step 0: Obtain data
- Step 1: Create the roads data set
- Step 2: Configure geometry properties
- Step 3: Upload the GeoJSON file (current)
- Step 4: Define and upload a movement path data set
- Further reading
Step 3: Upload the roads.geojson.gz file
Now that you configured the data set, let’s upload the roads.geojson.gz file.
Click the Upload GeoJSON button in the top navigation bar:
Figure 1. The Upload Data button in the top navigation bar.
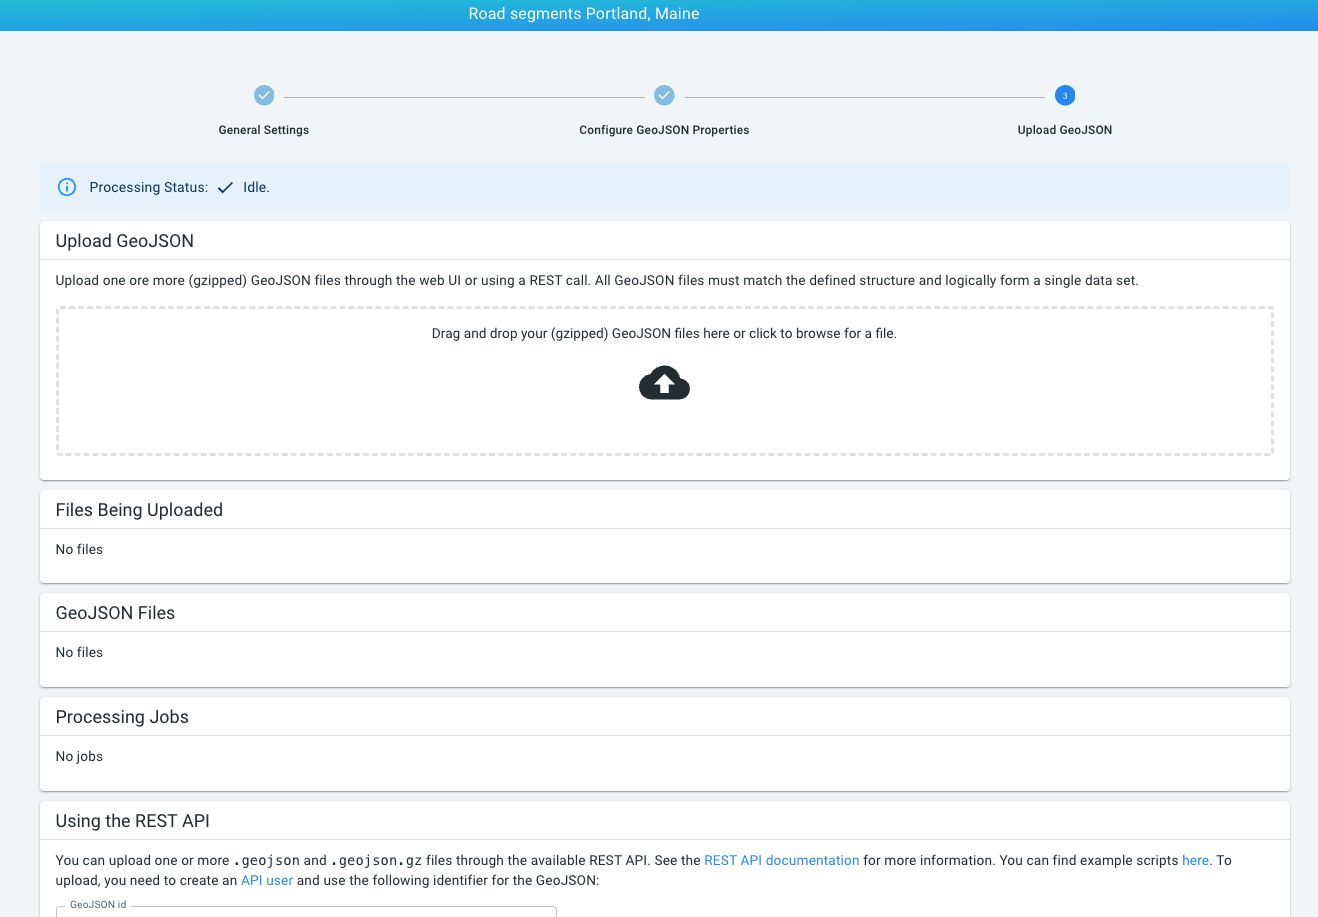
Step 3.1: Upload roads.geojson.gz
Now upload the roads.geojson.gz file by drag-and-dropping it onto the data upload area.
An alternative to drag-and-drop is clicking the area, which will show a file chooser where you can select your file.
|
You can drag-and-drop multiple files in one go
If you have multiple files to upload, you can select them all and drag-and-drop them in one go. |
While your file is being uploaded, it will be listed in the Files Being Uploaded area.
Once the file is uploaded, it will appear in the GeoJSON Files area. Here you can see which of your files are already processed, which are still queued, and access the processing log for each file by clicking on the Status link.
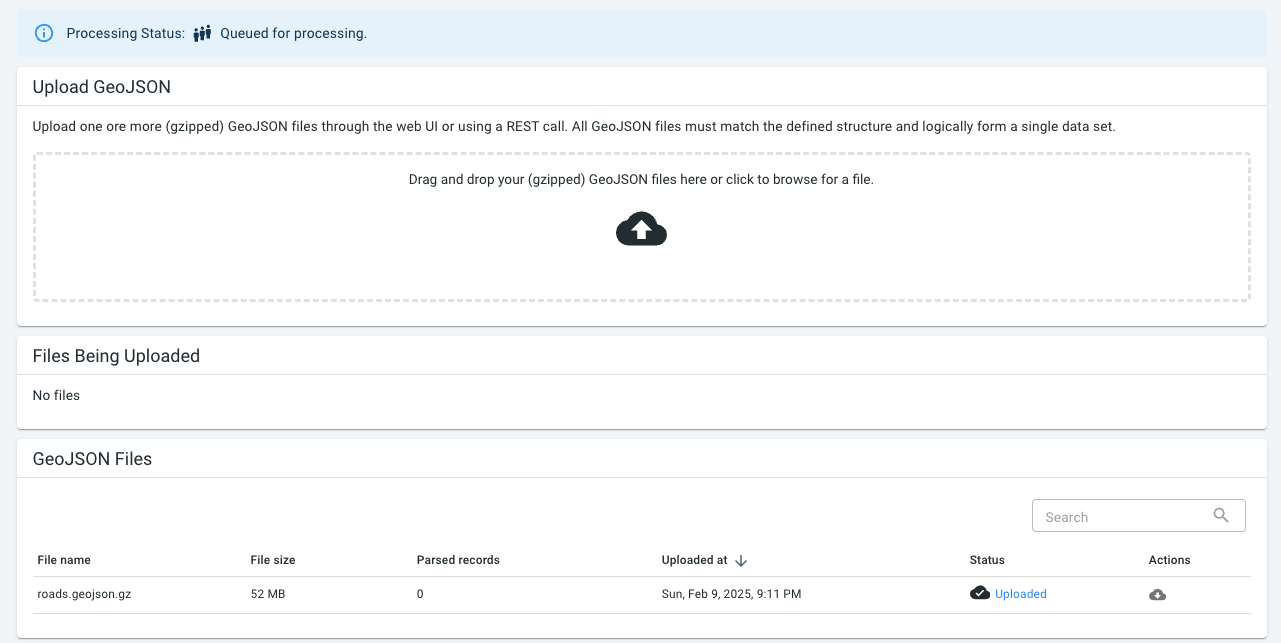
Figure 2. Once uploaded, the file appears in the GeoJSON Files area.
The Processing Jobs area shows the different processing jobs that have ran for that data set. For example, if you would add additional files, a new job will be started, and you would see multiple entries here.
|
During upload, you can navigate to other pages in the xyzt.ai platform
Once you have drag-and-dropped the files you want to upload, you can safely navigate away from this page and continue using the platform while your upload finishes in the background. The only requirement is that you keep the tab with the platform open and don’t refresh/reload to not stop the upload process. |
Step 3.2: How to know if your data is ready?
When working with large or many files, processing can take some time. Each uploaded file will be processed and at intermediate steps the results will be persisted to the cloud storage.
You can follow the status of the individual files as discussed above. When files have a status Uploaded or Processing, the data set is not ready. In addition, after handling the files, the persisting will take some time to finish.
You can follow the global process at the top of the page.
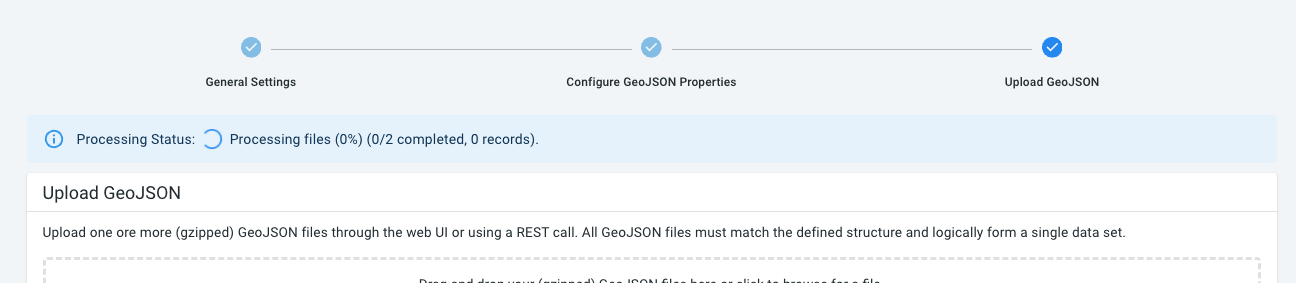
Figure 3. The processing progress as shown at the top of the data set creation pages. This data set is not finished and is still processing.
In addition, the processing progress is shown on the data set card:
-
Navigate to the Data sets page by clicking on Data sets in the navigation bar.
-
Click on YOUR DATA SETS (…) and scroll to or search for the data set you are looking for.
-
The status of the data set is indicated in the lower left corner of the card:
-
Queued means that a processing job is queued for the data set, and the data set is not ready.
-
Processing means that data is still being processed, and the data set is not ready.
-
All data processed means that the data set is ready.
-
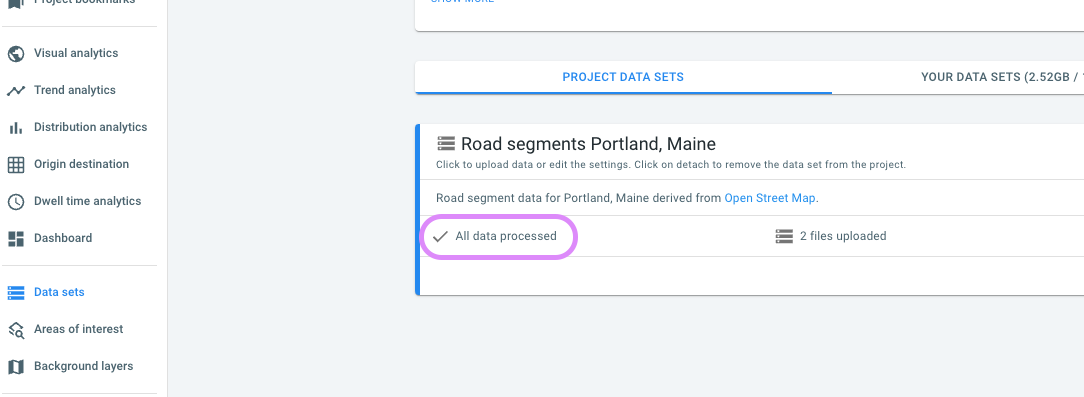
Figure 4. A data set that is ready for analysis as it is processed.
Step 3.3: Verify visually that your roads are processed
Now that your GeoJSON data is processed, let’s explore it on the Visual Analytics page.
Click on Visual analytics on the navigation bar on the left.
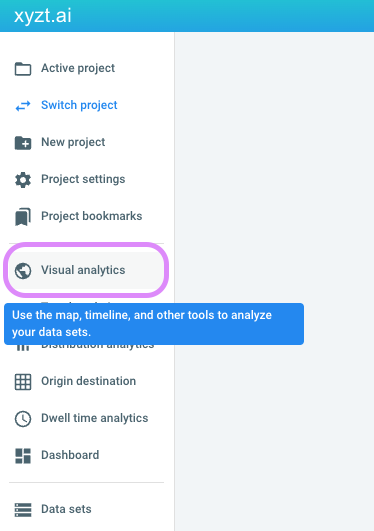
Figure 5. Navigate to the visual analytics page to explore the road network.
You should now see the road segments visualized by road class:
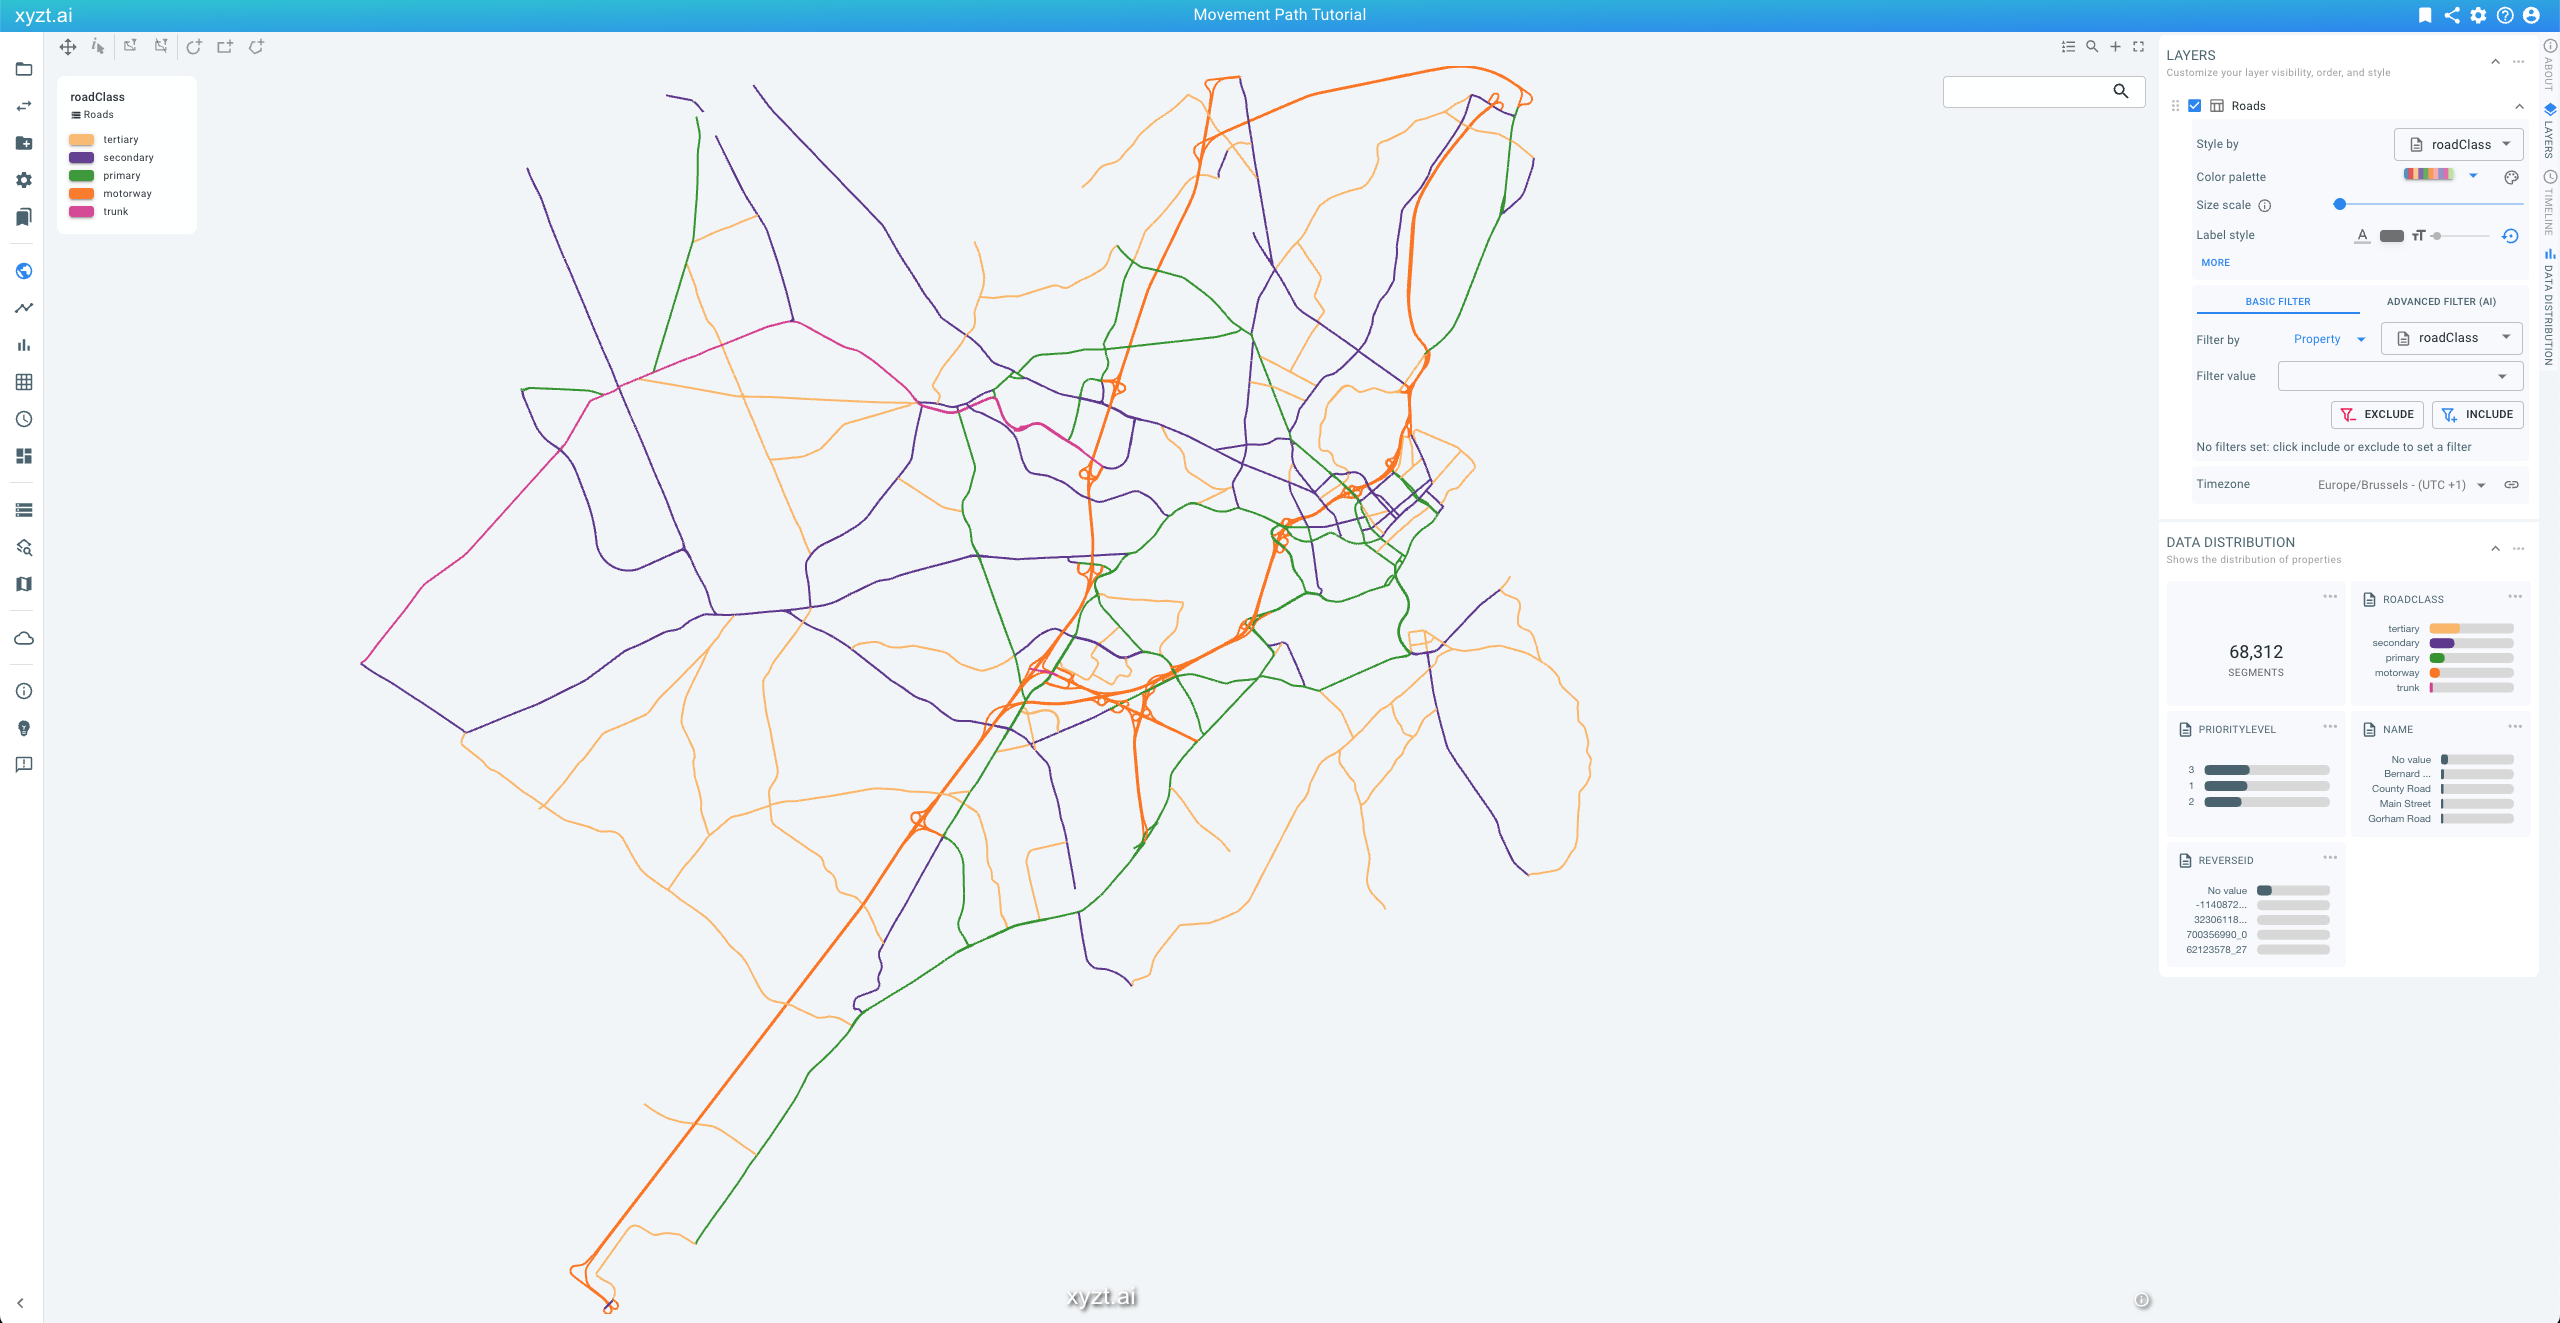
Figure 6. GeoJSON road segments visualized on the visual analytics page.
Zoom in to see more detailed roads. On the right side you can change the styling. For instance:
-
Set Style by to
reverseId -
Increase Size scale
You should now see two-way streets with two directions in different colors and arrows. One-way streets will be visualized in white.
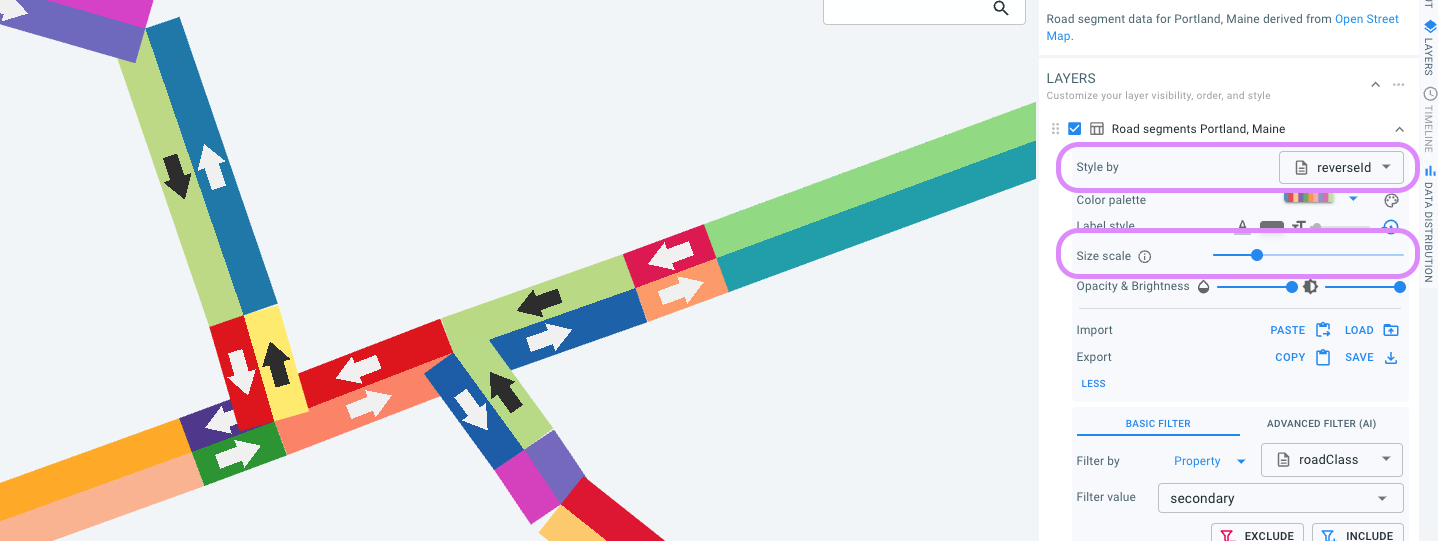
Figure 7. Revealing two-way street segments by zooming in on the data.
|
Try adding a background layer to your project.
To see the road segments together with aerial imagery, try adding a Mapbox background layer to your project. Note that when coming back to the Visual analytics page, the new layer will be set to invisible by default. You can make it visible by clicking its checkbox in the LAYERS panel on the right. |
Next part
Go to the next part: Step 4: Define and upload a movement path data set
Got feedback? Additional questions? Just want to have a friendly chat?
Get in touch!