Got feedback? Additional questions? Just want to have a friendly chat?
Get in touch!
Overview
In this article, you will learn more about the following functionality of the xyzt.ai platform:
-
Save and load an analysis: save all the filters, styling, properties, … you have configured for your analysis, so you can re-load them at a later time, and don’t have to restart from scratch. This is done by creating bookmarks.
-
Share your work: you can create a shareable link which gives people without a login to the platform access to your saved analysis.
-
Embed an analysis on another webpage: you can embed our interactive analysis and dashboard pages into another website.
-
Generate a report: by adding and combining the most important statistics and visualizations of your project onto a single dashboard.
Bookmarks
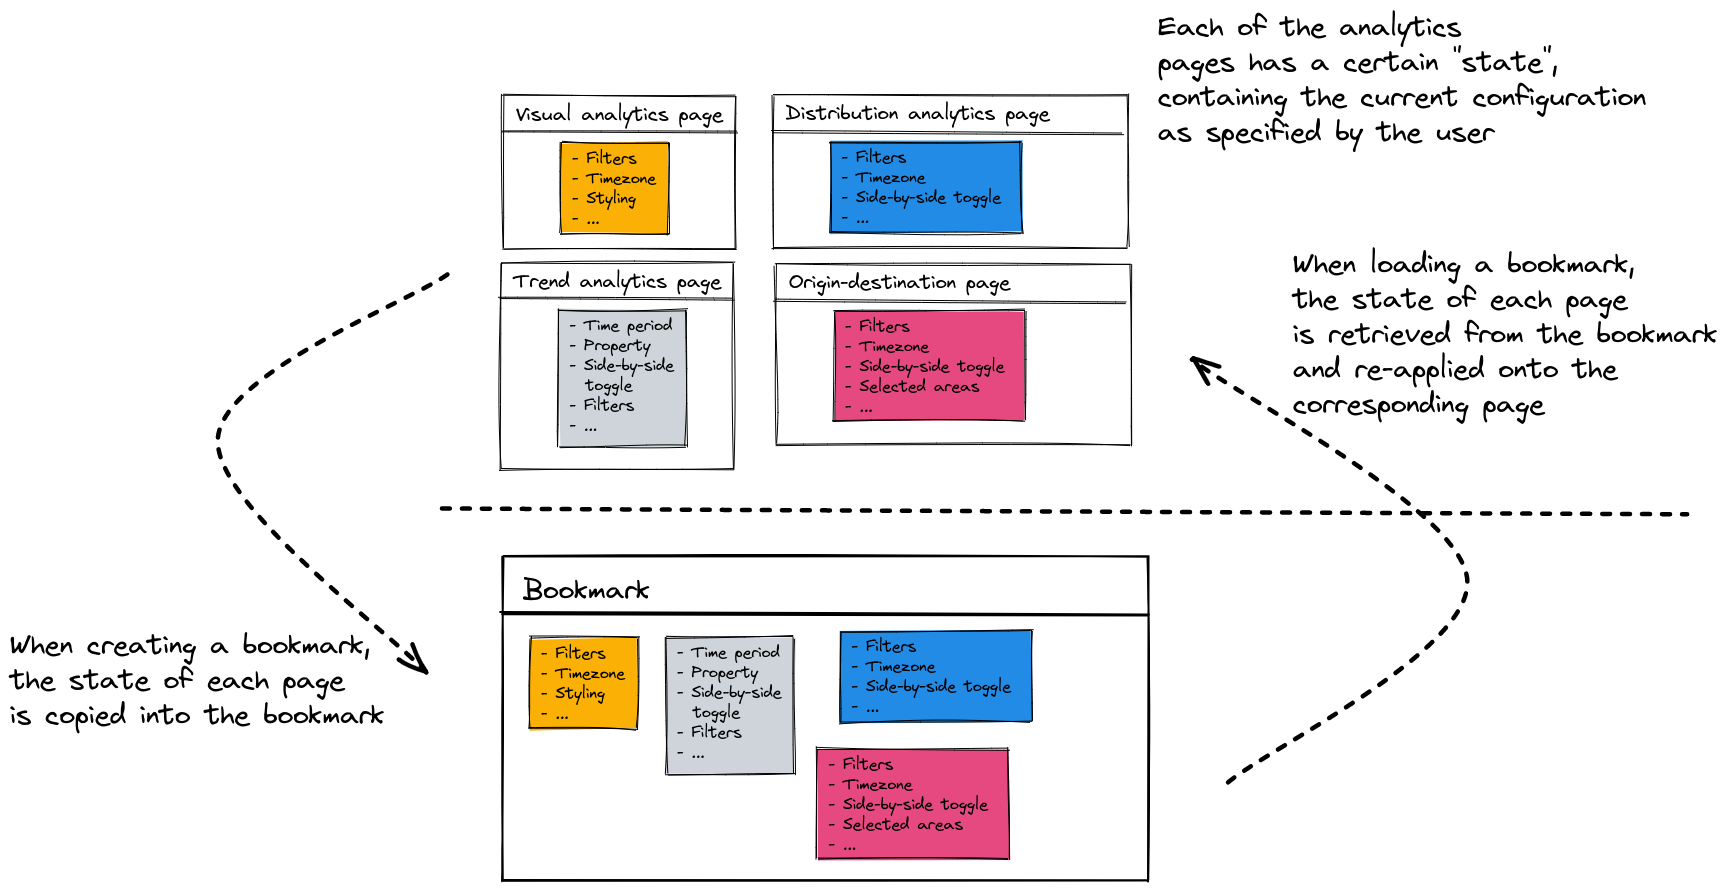
When you create a new bookmark for a project, you ask the platform to store the current state of all the analytics pages. This state includes:
-
Style settings
-
Configured filters
-
A single view or a side-by-side comparison
-
…
In short, everything you have configured on those analytics pages will be stored. Hence, when you load the bookmark and that stored state is restored, the analytics pages will be exactly like they were when you created the bookmark.
Figure 1. Overview of bookmark creation and loading
You can:
-
View all bookmarks for a project, even ones that were created by a team member. This makes it easy to share your analysis with a colleague.
-
Edit or delete existing bookmarks for a project.
-
Mark a bookmark as the default one for a project: when a project has a default bookmark, each time the project gets loaded the state stored in the default bookmark is applied automatically. This is a convenient way to for example adjust the default styling used in that project.
|
Bookmarks always save the state of all analytic pages
When you create a new bookmark, the bookmark will always store the state of all the analytic pages. Even when you create that bookmark while you are working on the visual analytics page, the bookmark will still store the state of all the analytic pages. |
External sharing and embedding
You can give an external person access to:
-
The visual analytics page
-
The trend analytics page
-
The distribution analytics page
-
The origin destination page
-
The dashboard
This is done by creating a link.
To control what the visitor sees when accessing the link, you create the link for a specific bookmark. When somebody browses to that link, the page will show the state stored in the bookmark for which the link was created.
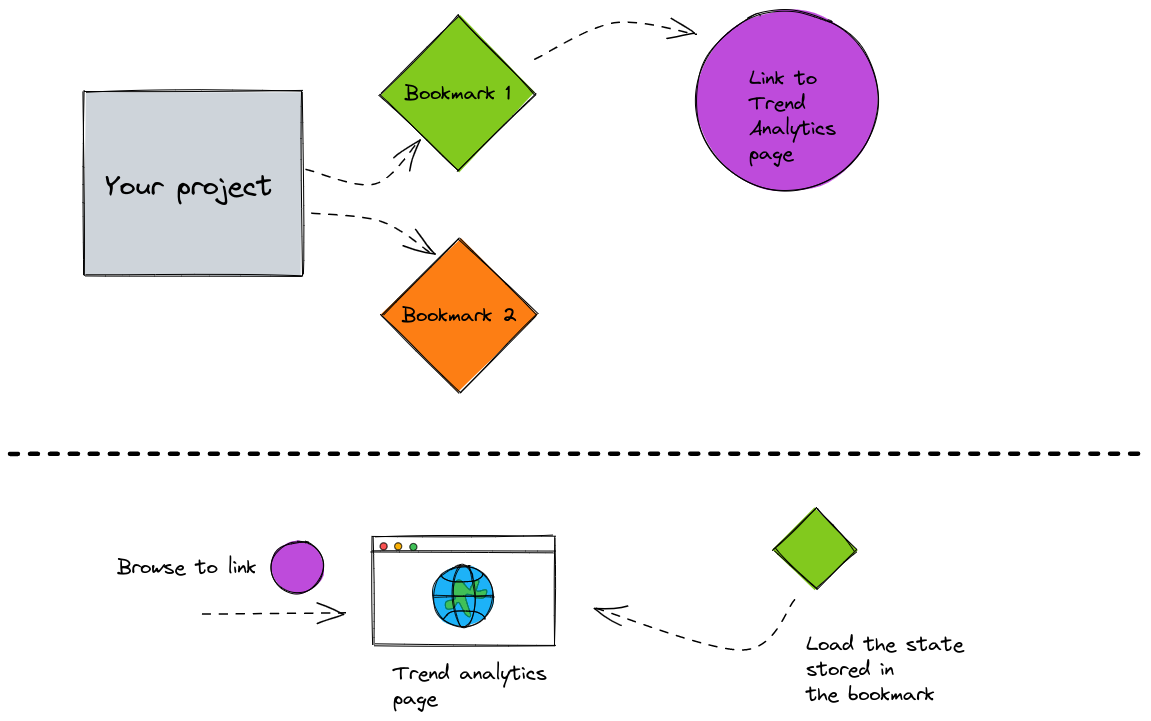
Figure 2. The relation between a project, its bookmarks and their links
This also means:
-
If you delete the bookmark, the link will no longer work
-
If you update the bookmark, people visiting the link afterwards will see the updated state
The link will only provide access to that specific page. If you want to share multiple pages, you will have to create multiple links.
Each link that you create also comes with code to embed the linked page onto an external website. You could use that to add an interactive page to your own website for cases where a screenshot doesn’t suffice.
|
Creating a shareable link makes your data accessible to everybody with access to that link
Shareable links are accessible by anyone and do not require the user to log in to the platform. The link does not provide a static image of the shared page. Instead, it provides full interactive (read-only) access to the platform. The user can navigate the map and manipulate the filters and styling settings, and see your data. Make sure to only do this for data that you are allowed to share with the world. If you only want to share with a team member, simply point them to a bookmark. |
Reporting dashboard
The dashboard is a place where you can collect the most important numbers and visuals from your different analytics, so that they become easily available.
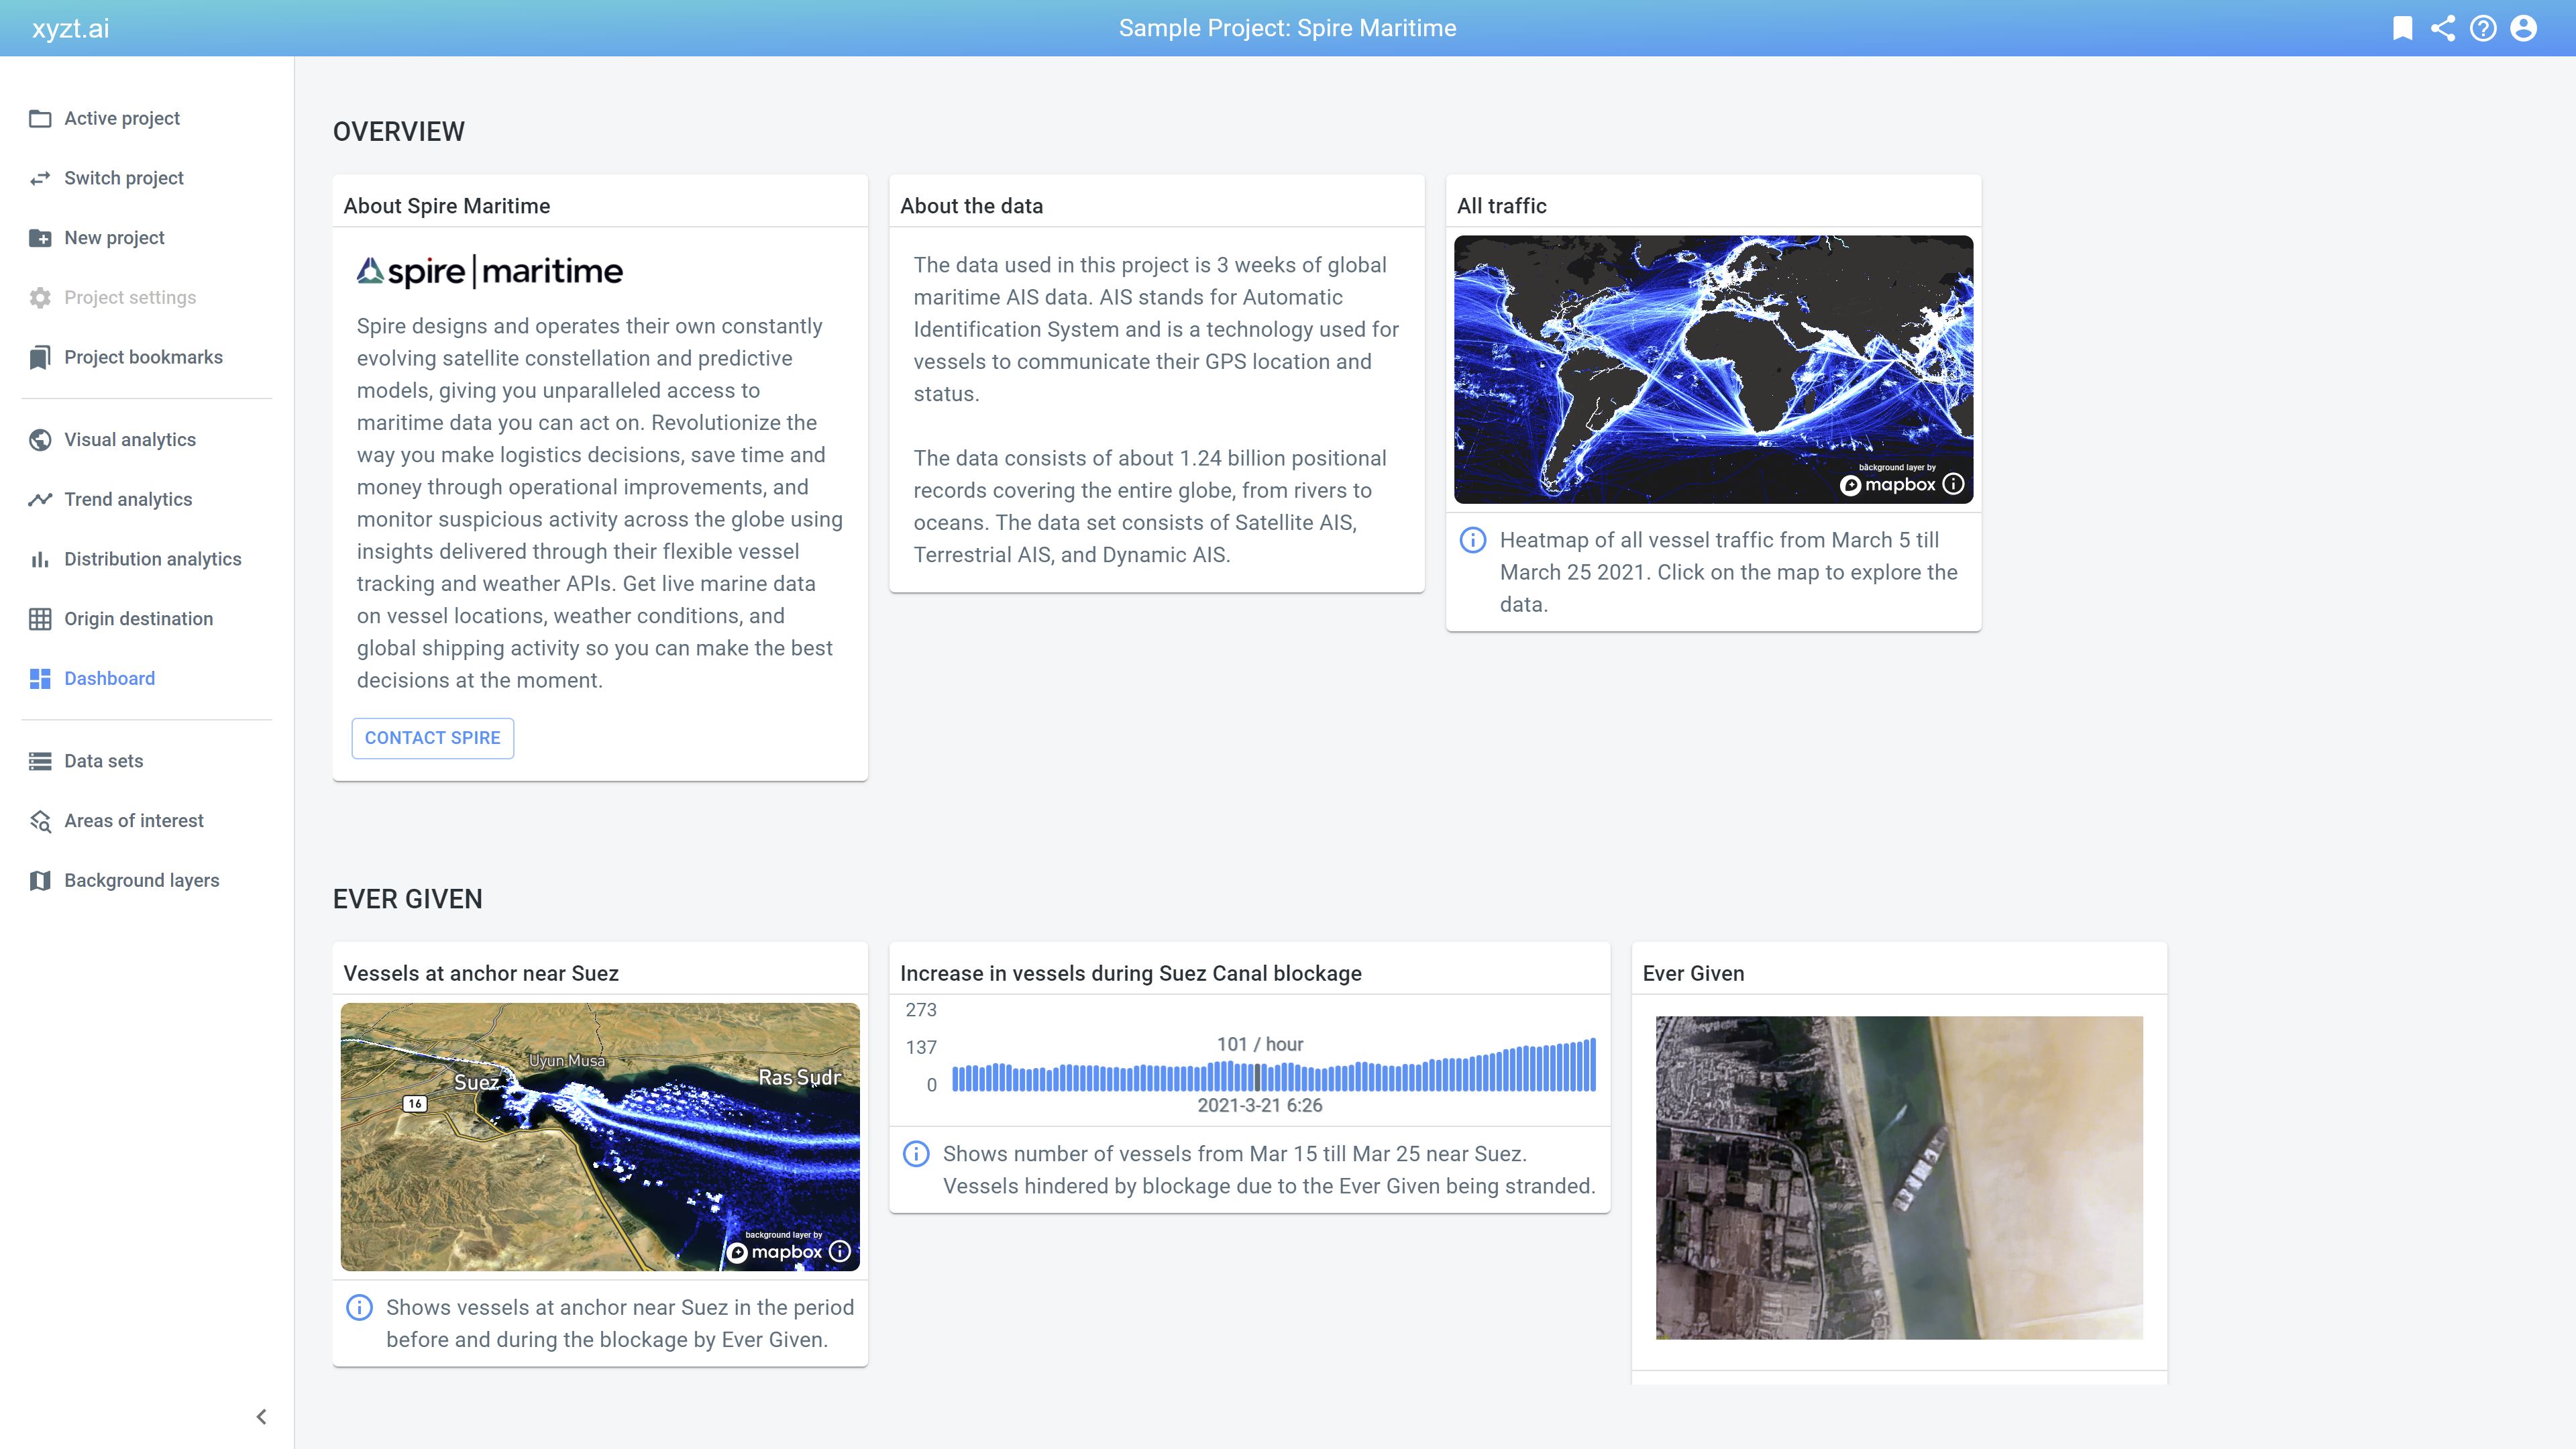
Figure 3. Example dashboard from one of the sample projects.
Adding widgets from the analytics pages
Each time you perform an analytics, you can right-click on the UI elements (data distributions, spatial maps, timelines, …), and select Add as widget. This will add a small version of that UI element to the dashboard of your project.
Adding widgets enables you to build a story around your analysis showing heatmaps, trend lines, distributions, together about your data.
Manipulating widgets on the dashboard
On the dashboard itself, you can:
-
Add your widgets into groups.
-
Re-order the widgets, or remove them again.
-
Add a title at the top of the widget.
-
Add a short info message underneath widget.
-
Click on a widget, which takes you back to the corresponding analytics page. The state of the page will be restored to the state that was used to create the widget.
-
Delete widgets.
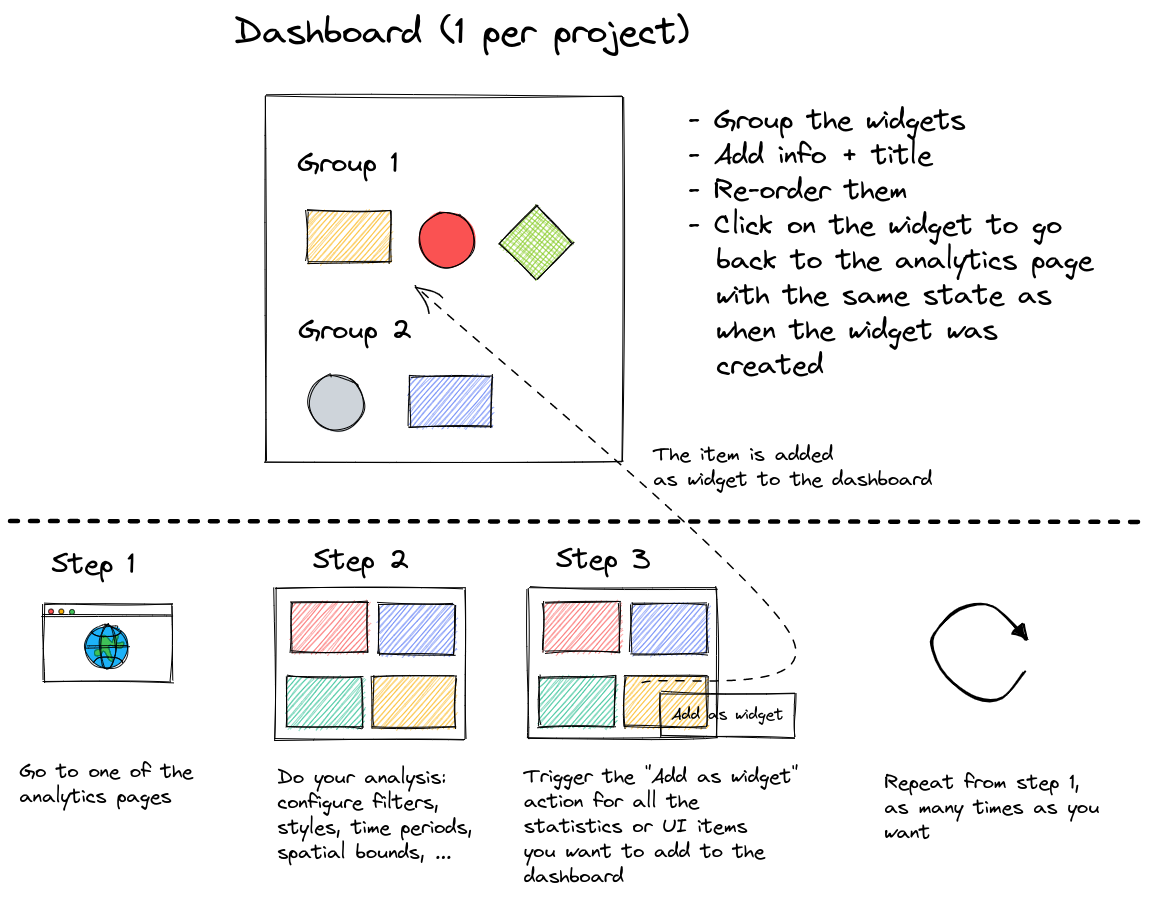
Figure 4. The main features of the dashboard
Widgets are live in two ways:
-
The widgets are not just a static image. When new data is added to the data sets used in the widget, your widget will be updated, e.g., showing different statistics or visualizations taking the new data in account.
-
When you configured your analytics to provide information for example on the last hour, last week, last day, etc., then the widget will update when new data is added, for example through the use of the data upload API.
-
-
You can click on the widget to take you back to the fully interactive analytical page to further inspect, explore, and analyze the data and insights behind the widget.
Imagine you created a widget and want to update its settings, e.g., you applied the wrong filter. To do so follow these steps:
-
Click on the widget to take you back to the analytics page, e.g. the Visual analytics page.
-
Update the settings you wish to change, e.g., by adding a filter.
-
Right-click on the UI element that you want to use as a widget, e.g., by clicking on the map.
-
Choose Add as Widget to place the updated widget on the dashboard.
-
Go back to the Dashboard page and remove the old widget.
-
Move the new widget to the right place.
Adding description widgets
Each widget can have a description below the widget, to explain to the user what is shown on the widget. You can edit this description after you created the widget.
In addition, the dashboard itself allows adding dedicated description widgets as well. This is a widget that supports some basic HTML tags (for example links, images, bold, italic), and that is typically used to provide some additional information about the dashboard to the viewers.
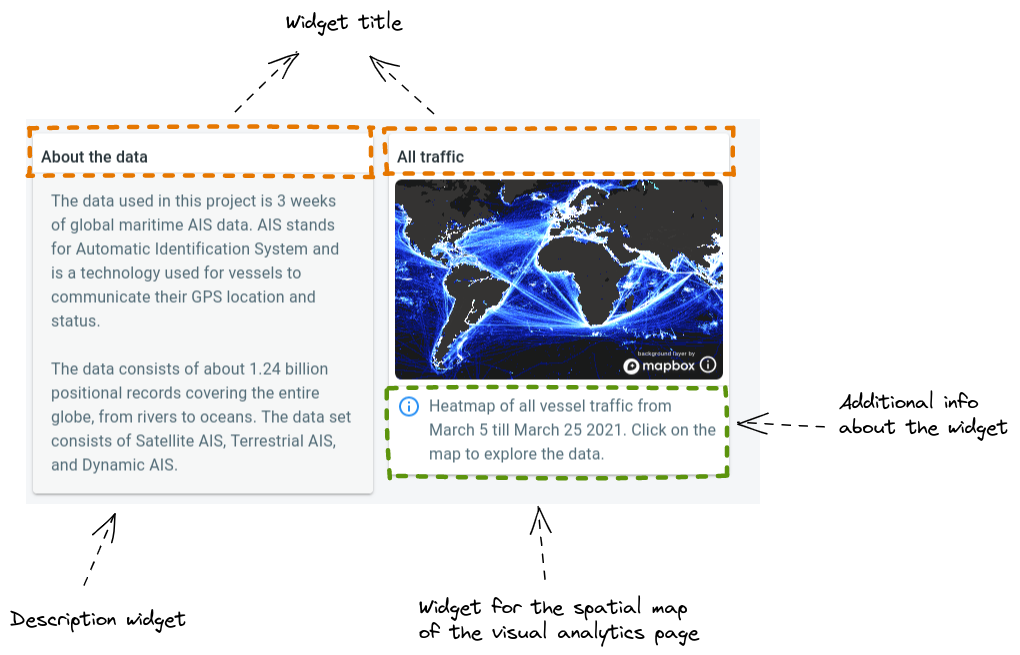
Figure 5. Examples of widgets: the left one is a description widget and the right one is a widget created for the spatial map of the visual analytics page
Sharing your dashboard
As discussed above, you can share and embed your dashboard through the shared link capability.
|
The state of the dashboard is not included in the bookmark
The "state" of the dashboard is not included in a bookmark. Only the latest version of the dashboard is available, even when you create multiple bookmarks for your project. For example:
|
Further reading
More information on working with bookmarks and links:
More information on the dashboard UI can be found in this article.
Learn how to work with widgets and dashboards by following one of the starter tutorials:
Or explore one of the dashboards of the existing sample projects in the platform:
Got feedback? Additional questions? Just want to have a friendly chat?
Get in touch!