Available parts
- Goal
- Understanding aggregate time series data
- Create new project
- Visual analytics
- Trend analytics
- Create a dashboard
- Sharing your insights (current)
- Conclusion
Step 6: Sharing your insights
Now that we have finalized our analysis and created a dashboard, we can share our results with others. This is easily done by clicking on the second icon (the shared link icon) in the top-right corner of the page.
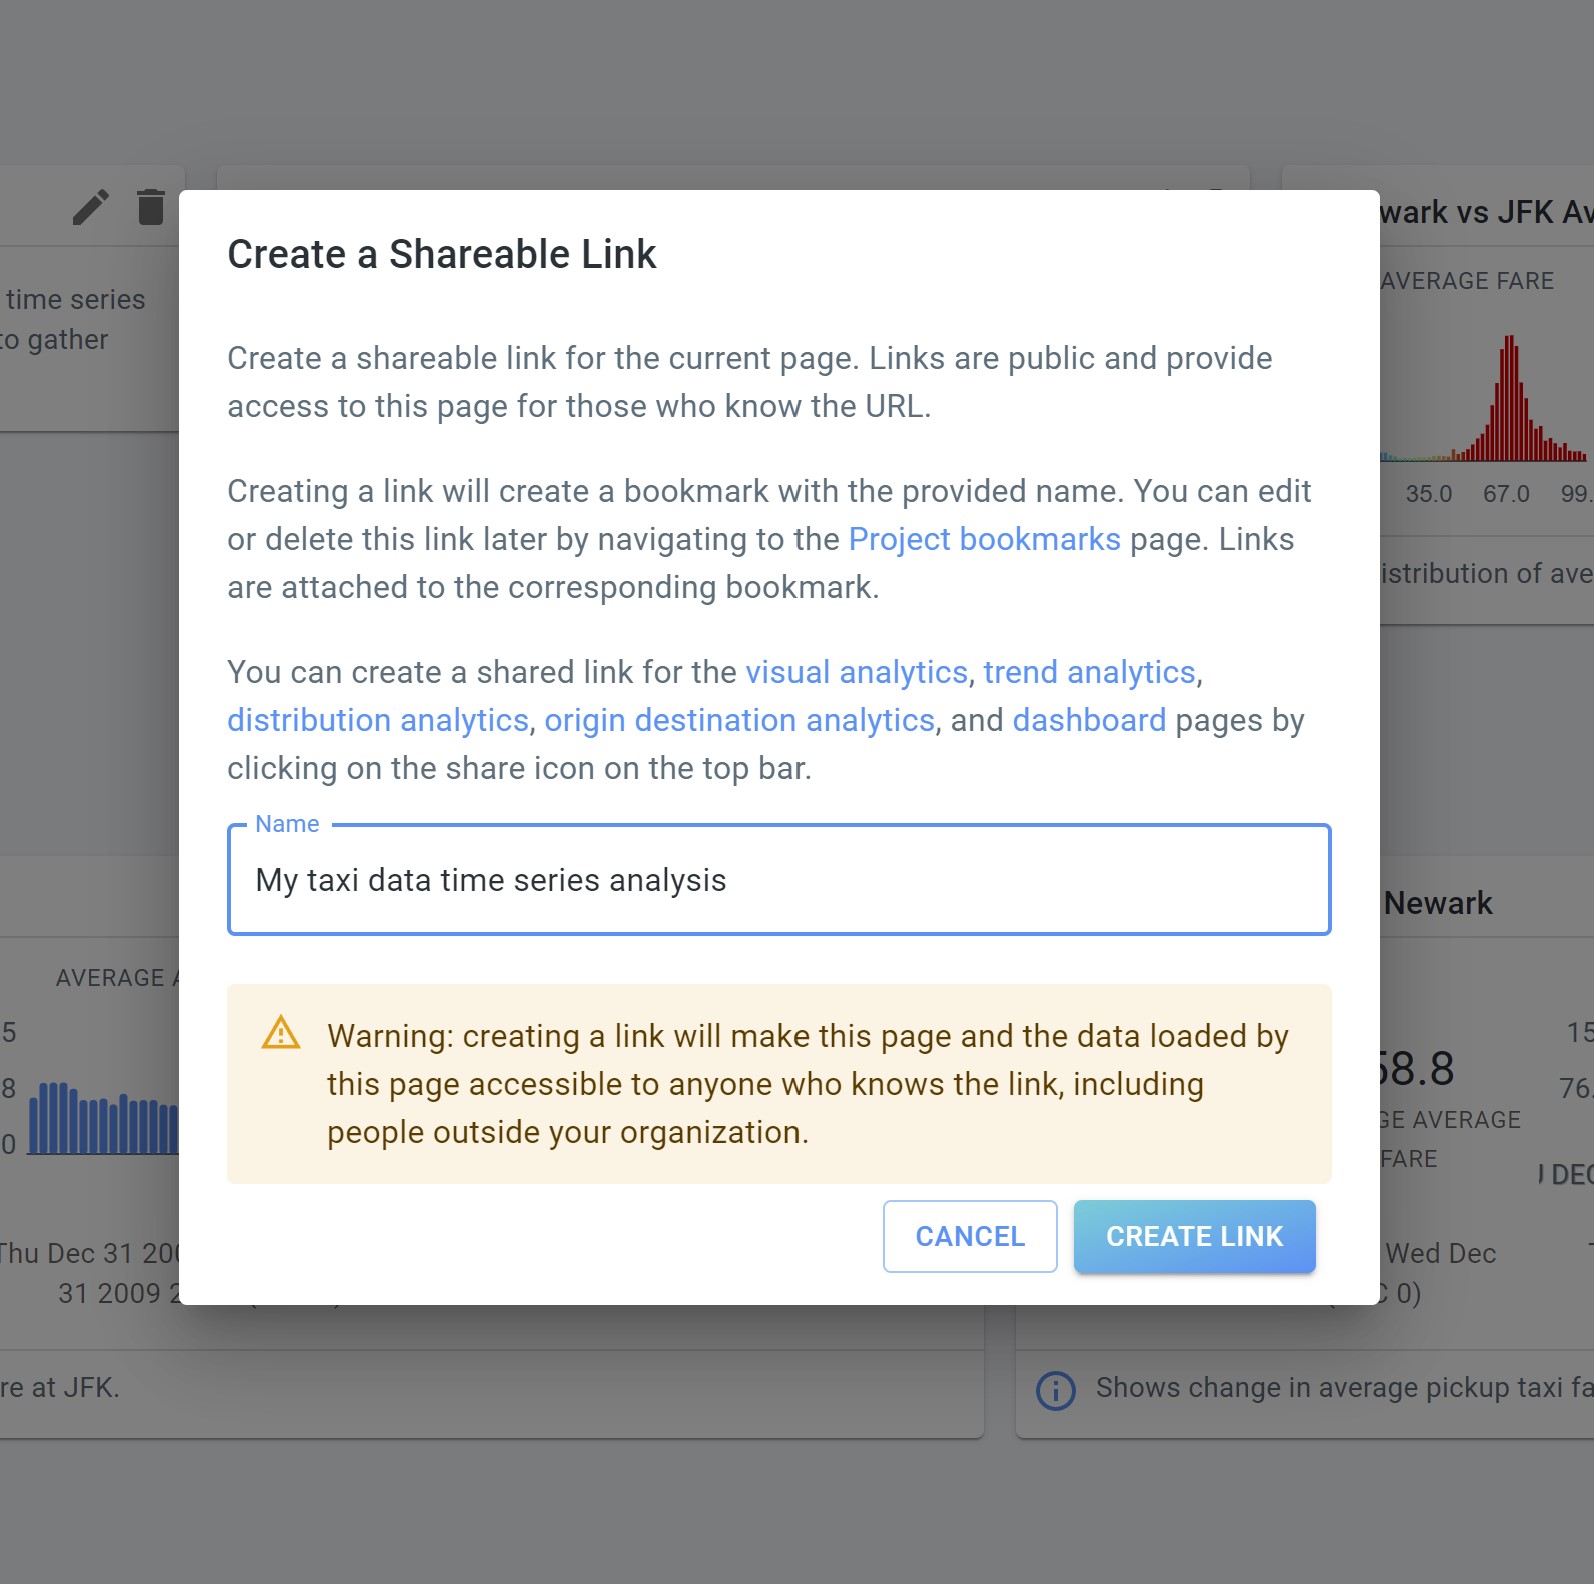
You should now see a dialog that says Create a Shareable Link.
Provide a name for the link, e.g., My taxi data time series analysis, and click CREATE LINK.
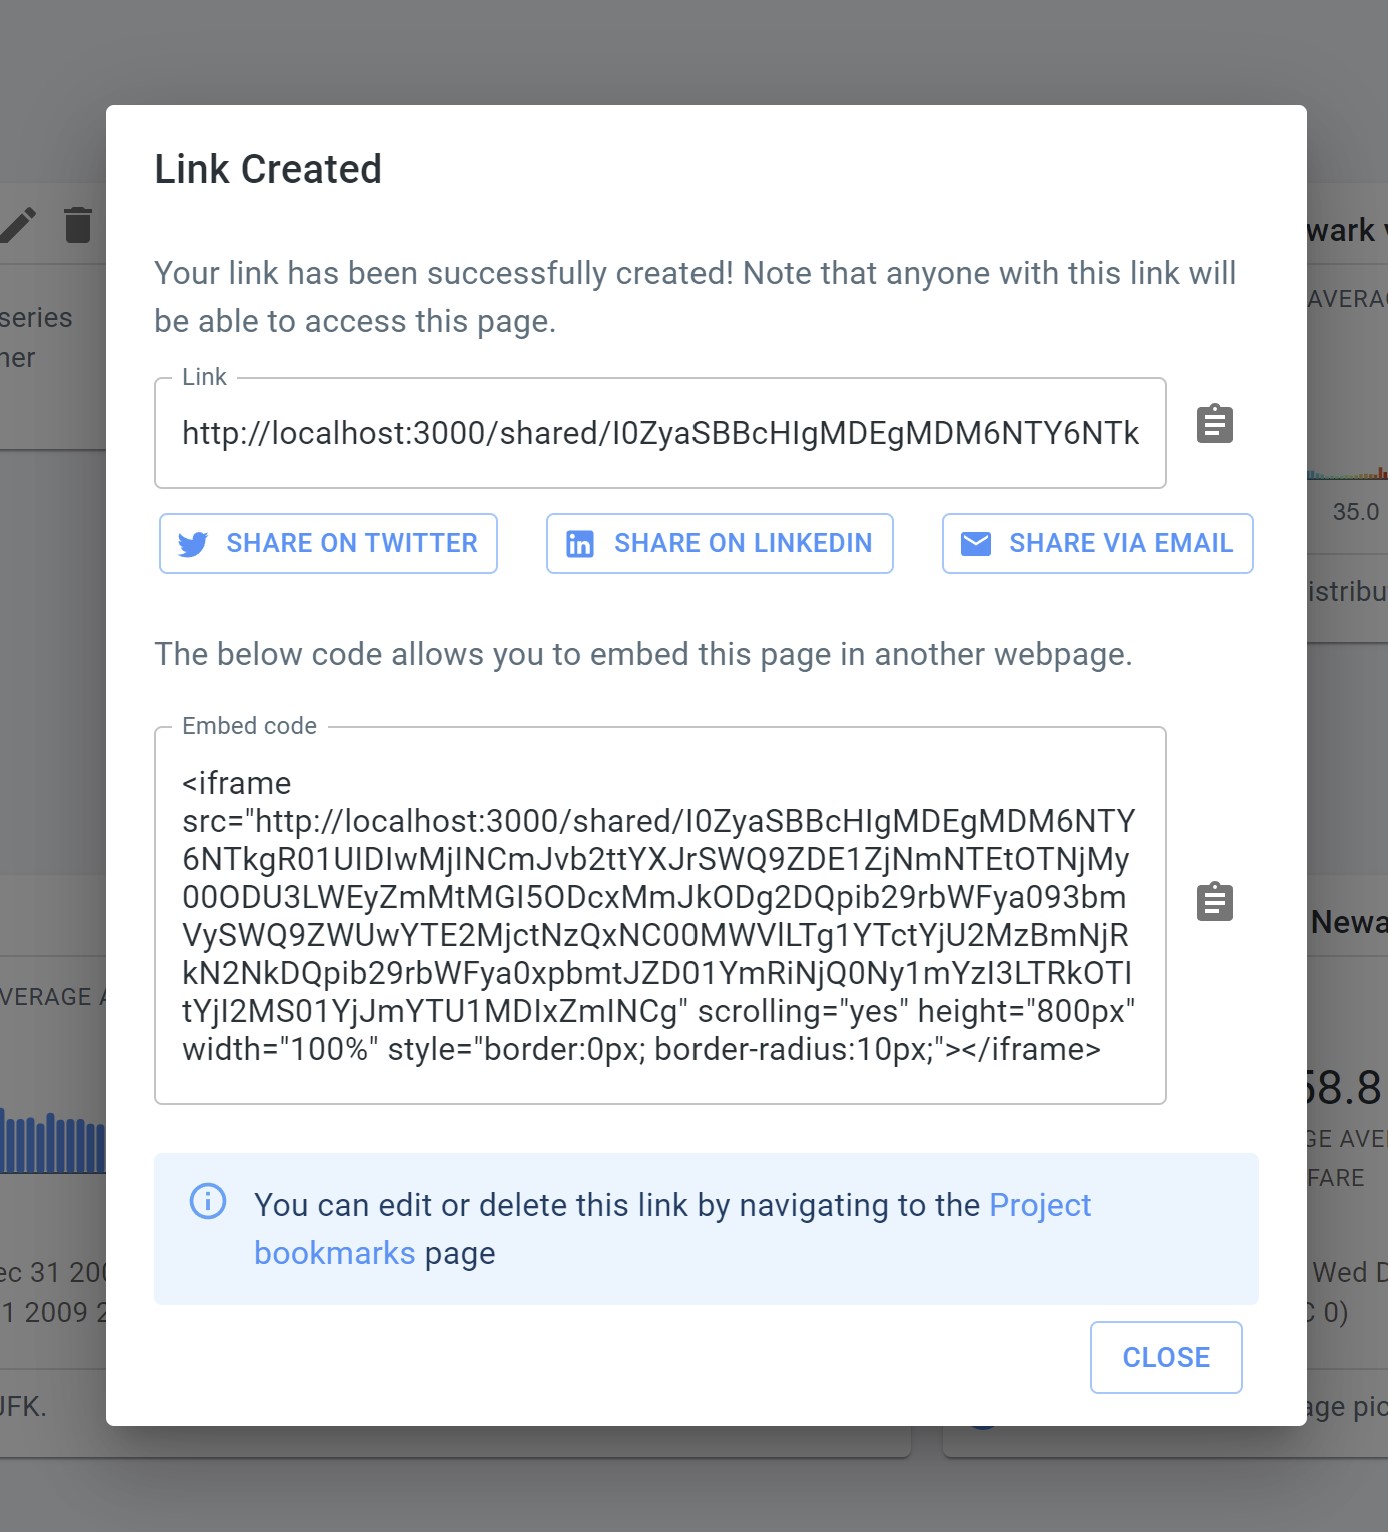
Copy the link and send it by e-mail to any user. To see how others receive the link, open a second browser window and copy-paste the link in the location bar and hit enter.
The receiving user sees the dashboard with the widgets that we created. The user can also click on the widget to go to the page where the widget was created:
-
Click on the dual map widget.
Notice how the Visual analytics page opens with the configured state when the widget was created.
You can go back to the dashboard by clicking on Back to dashboard in the top left corner.
Next part
Go to the next part: Conclusion


