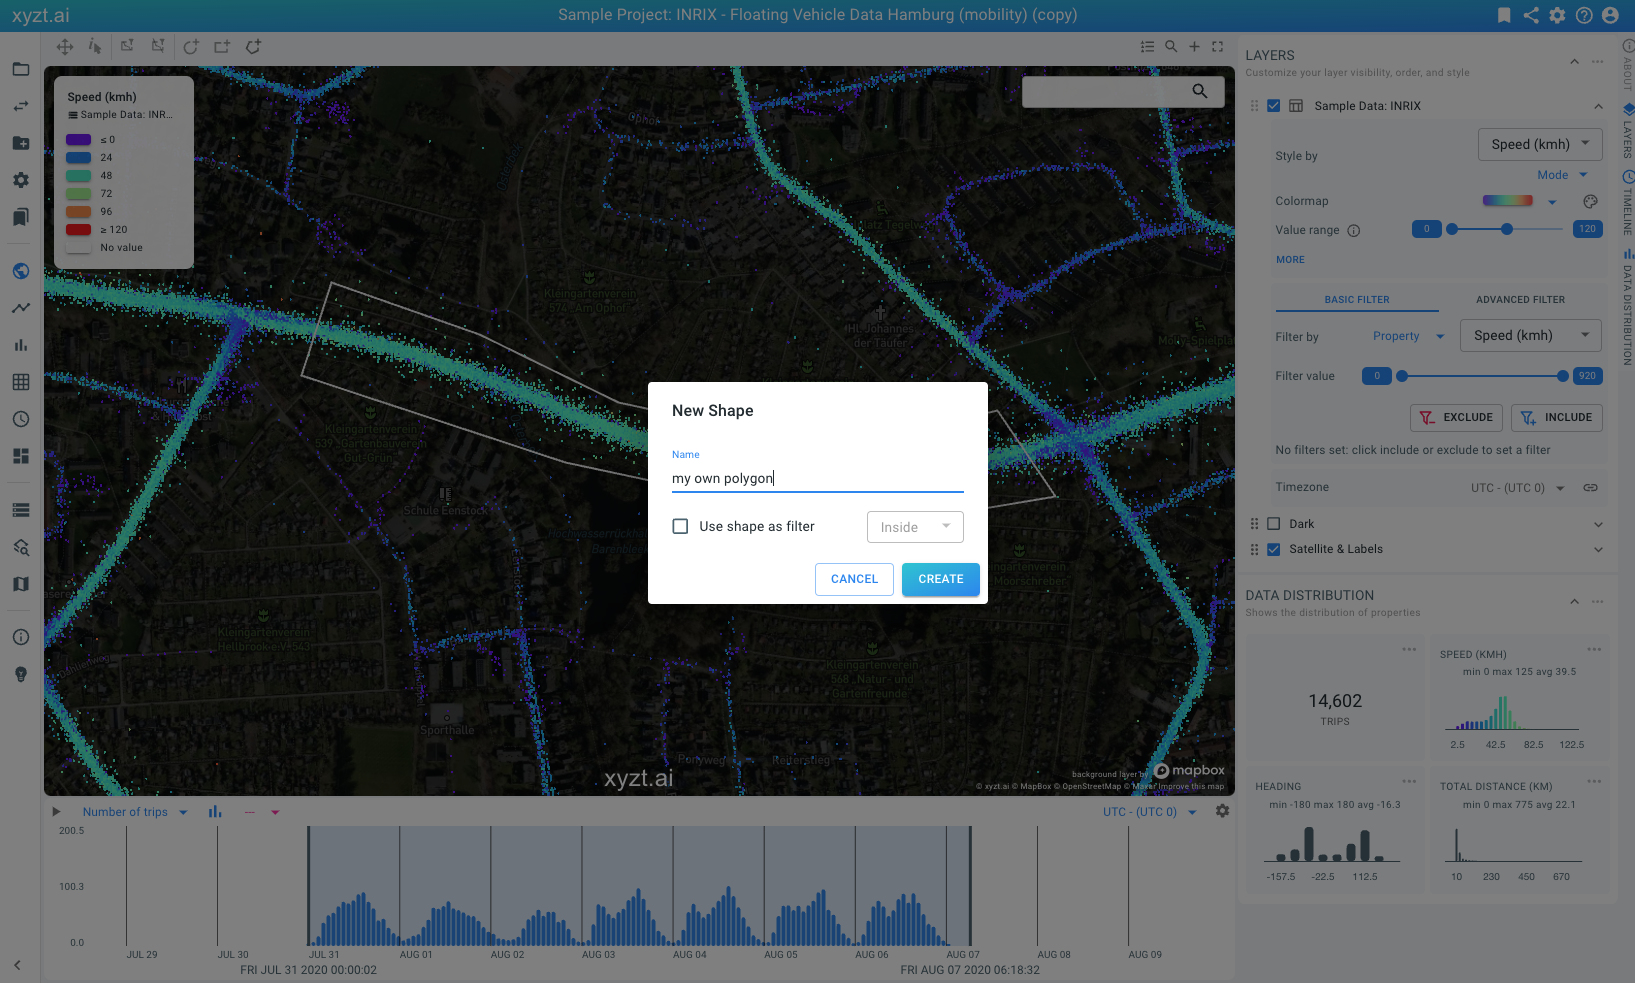
Figure 1. Drawing a polygon
This article explains how to create and draw your own shapes and use them for analysis on the different analytical pages. A drawing shape is a polygon created by drawing on the map using one of the shape creation controllers. You use such polygons to filter data about a specific area or to analyze data for a specific area, for example, a highway section, or an anchorage zone,…
As drawing polygons is done through the visual analytics page, it is strongly recommended to first read the introduction article which explains how the visual analytics page uses these filters.
|
Figure 1. Drawing a polygon
|
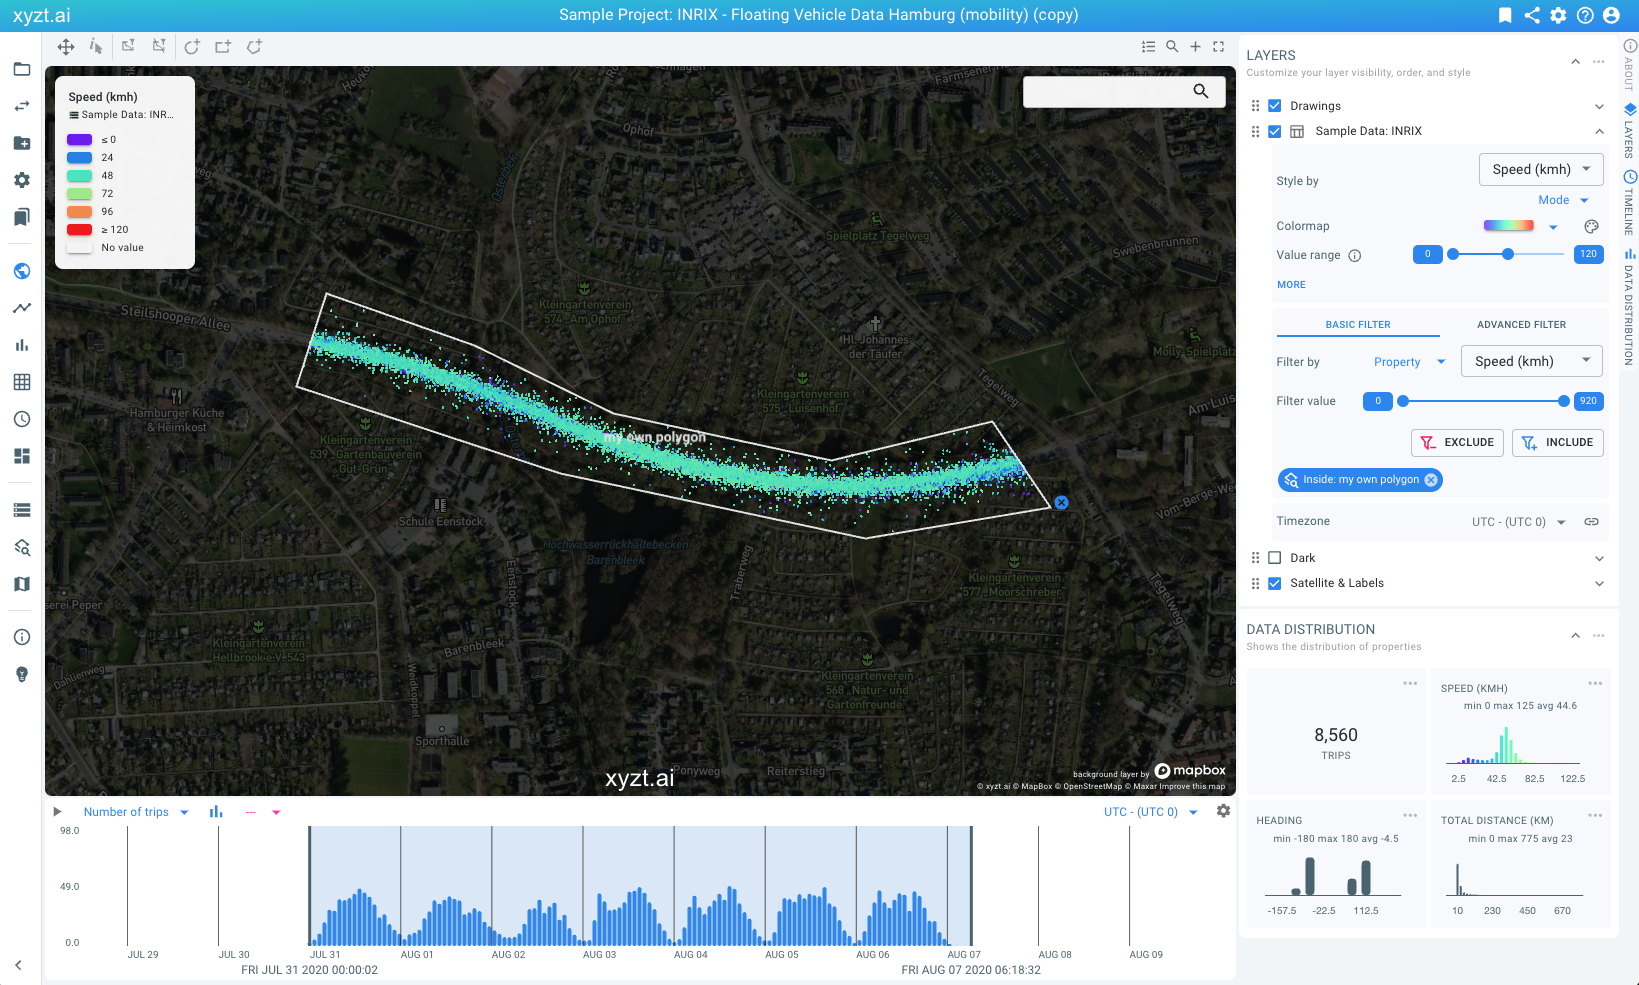
Figure 2. Using your own drawn polygon
|
To draw shapes, you need a project with a data set attached. Then follow these steps:
Open the visual analytics page
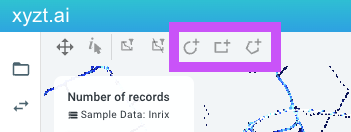
Select one of three shape creation controllers from the toolbar above the map. You can create a circle, a rectangle, and a polygon
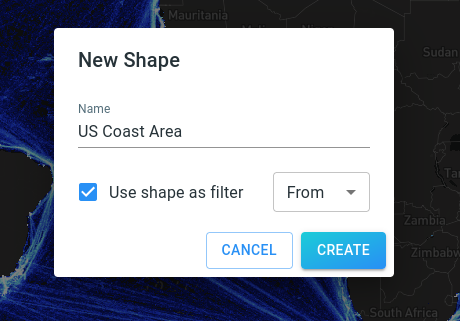
Click on the map to create the shape. When done, a dialog appears that asks for a name.
|
During shape creation you can navigate and zoom in and out on the map by holding the alt/option key while manipulating the mouse. In addition, when creating a polygon, you can remove the last point with the backspace/delete key. |
After you draw the first shape, a new layer with the name Drawing appears in the Layers panel. This layer corresponds to an automatically created layer that will also appear under
the project’s areas of interest layers.
When you delete the last shape of a drawing layer, the layer is automatically removed as well.
|
A separate drawing layer is created for each user. If two different users draw shapes for the same project, each will have their own drawing layer. |
You can delete a shape by clicking on the shape and pressing the delete button.
You can delete an entire drawing layer as follows:
Navigate to the Areas of Interest
Click on the DELETE button on the card of the Drawing layer

After you delete a drawing layer, all shapes are gone. If you start drawing a new shape on the map, a new drawing layer will be created.
The drawn shapes can be used as spatial filters on the different analytics pages and as areas of interest, for example to compute trends for on the Trend Analytics page.
See here on how to use the shapes for spatial filtering on the Visual Analytics page.
The other pages where the shapes can be used as filters and as areas of interest are:
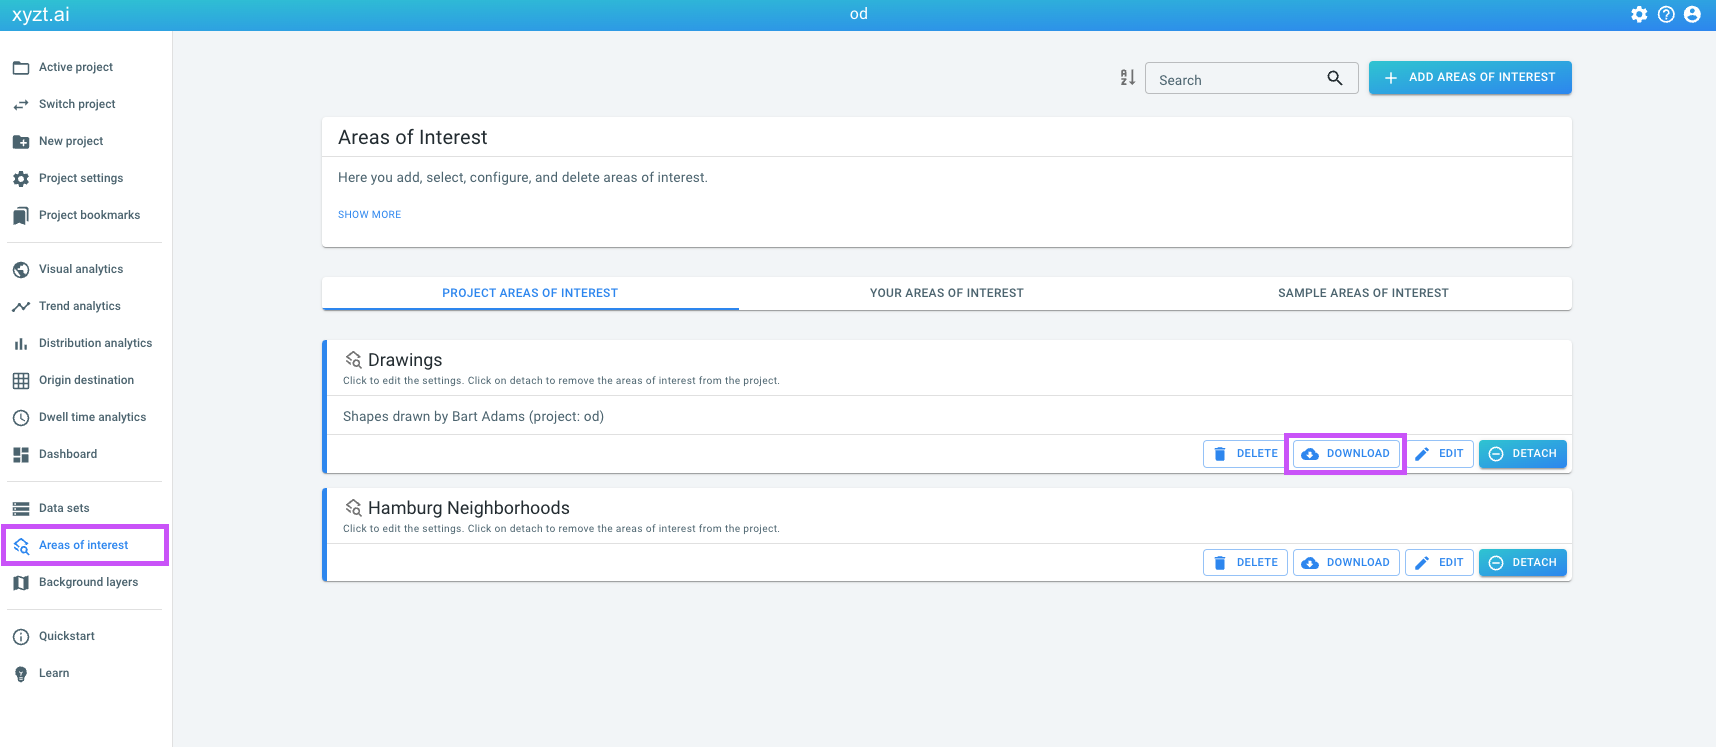
You can download the shapes drawn as a GeoJSON file using these steps:
Navigate to the Areas of Interest page
Click on the DOWNLOAD button of the respective drawing layer card
Your drawing layer can be attached and used in other projects. Similarly, drawing layers can be detached from a project. However, there are some caveats:
A drawing layer of project A, when attached to project B, will not be editable in project B. You can still create shapes in project B, but they will be created in a different drawing layer.
When a drawing layer of a project is detached, it becomes a regular areas of interest layer and becomes uneditable, even after re-attaching it to a project.