Got feedback? Additional questions? Just want to have a friendly chat?
Get in touch!
Available parts
- Goal
- Understanding AIS data (current)
- Create new project
- Visual analytics
- Trend analytics
- Origin-destination
- Create a dashboard
- Sharing your insights
- Conclusion
Step 0: Understanding AIS data
For this step, we will use a sample project. The sample projects are read-only. Later in the tutorial we will create our own project.
The data that we will be using in this tutorial is a global AIS data set from Spire Maritime. It is already present in your account.
AIS stands for Automatic Identification System. It is a technology used for vessels to communicate their position and status so that it can be used for collision avoidance and vessel tracking services. It is also valuable for maritime location intelligence to extract insights from historical data as you will learn in this tutorial. The data is collected both through terrestrial receivers and satellite receivers.
To load a project containing this data set:
-
Click on Switch project on the left navigation bar
-
Click on SAMPLE PROJECTS
-
At the top of the screen, in the search box type Spire Maritime. This will only show the projects that match the search string.
-
Click on the VISUAL ANALYTICS on the card Sample Project: Spire Maritime
This will take you to the Visual analytics page.
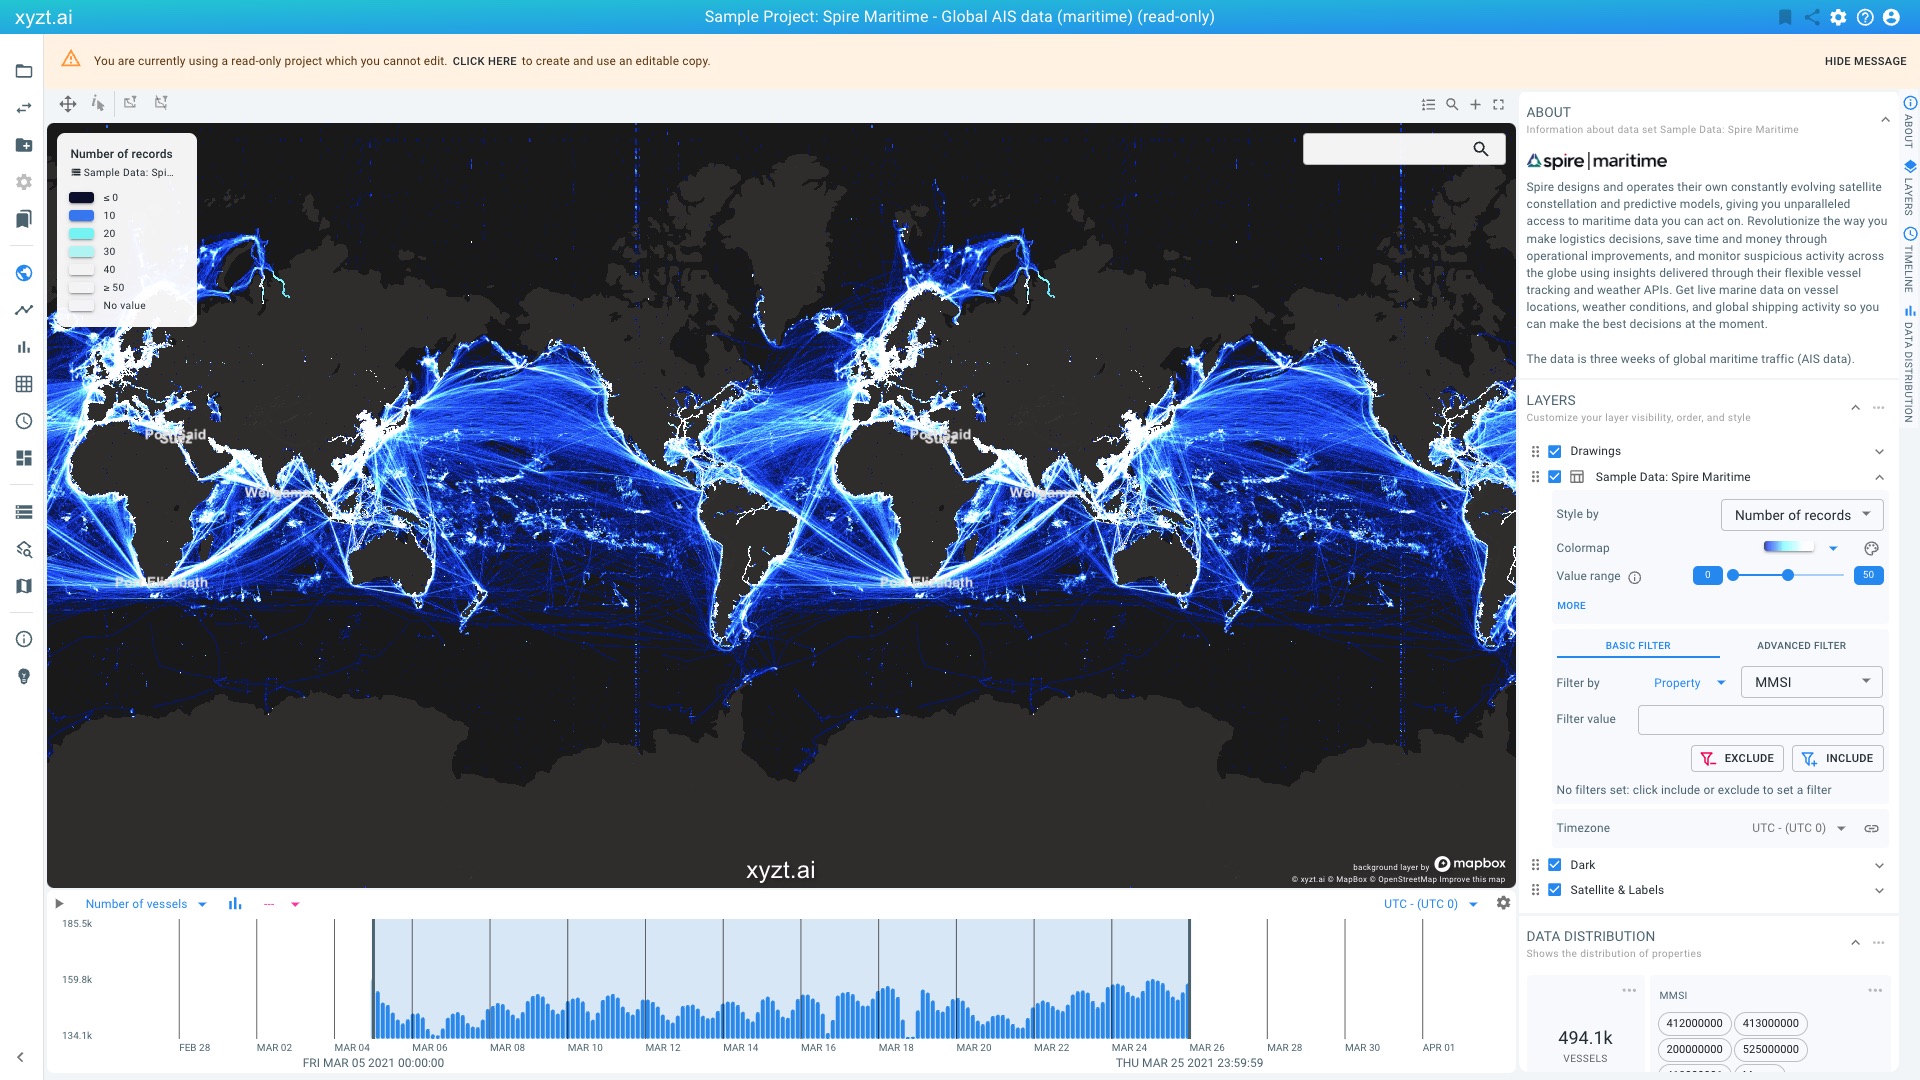
Figure 1. Analyzing vessel AIS data.
This map-centric page is the center of the platform, and probably what you will use most.
The visualizations you are looking at are different views on the AIS data records:
-
The map shows a density map from dark blue to white. This indicates where most vessels were for the given time period.
-
The timeline at the bottom of the screen shows a histogram with the number of vessels over time, counted in periods of 1h, 3h, etc.
-
The lower-right side shows smaller widgets with distributions of properties in the data. You might have to scroll down to reveal the widgets.
Maritime AIS data consists of GPS locations of vessels, recorded at multiple time instances (for example every 5 seconds), with many associated attributes such as speed, heading,… Other properties found in AIS data are:
-
The draught of the ship.
-
The ship type, e.g., cargo, tanker, fishing,…
-
The status of the vessel, e.g., Moored, At anchor, Underway using engine,…
-
…
In the example data set, following properties make up each record:
-
MMSI: a unique identifier for a vessel. All records belonging to the same vessel will have the same identifier.
-
Longitude: the horizontal coordinate (typically in WGS-84 reference)
-
Latitude: the vertical coordinate (typically in WGS-84 reference)
-
Time stamp: the time the record was logged
-
Speed (knots): the speed of the vessel
-
Course: the heading of the car (in degrees)
-
Draught (dm): the draught of the vessel in dm
-
Ship type: the type of the ship, e.g., Cargo, all ships of this type, Fishing,…
-
Status: the status of the ship, e.g., Underway using engine, Moored,…
-
Collection type: how the record was collected, through satellite, through a terrestrial receiver, or through a receiver on another ship (Dynamic A and B)
Spire provides many more properties or attributes with AIS data, but for the case of simplicity, these were left out in the example data set.
Next part
Go to the next part: Create new project
Got feedback? Additional questions? Just want to have a friendly chat?
Get in touch!