Got feedback? Additional questions? Just want to have a friendly chat?
Get in touch!
Available parts
- Goal
- Understanding floating vehicle data
- Create new project (current)
- Visual analytics
- Trend analytics
- Origin-destination
- Create a dashboard
- Sharing your insights
- Conclusion
Step 1: Create a new project
The sample projects are read-only projects, meaning we cannot modify them by drawing new shapes on the map or creating new widgets on the dashboard.
Therefore, we will create a new project and attach the INRIX trips data set to it, so that we can then perform our first analysis tasks.
To create and set up the project with the trips data:
-
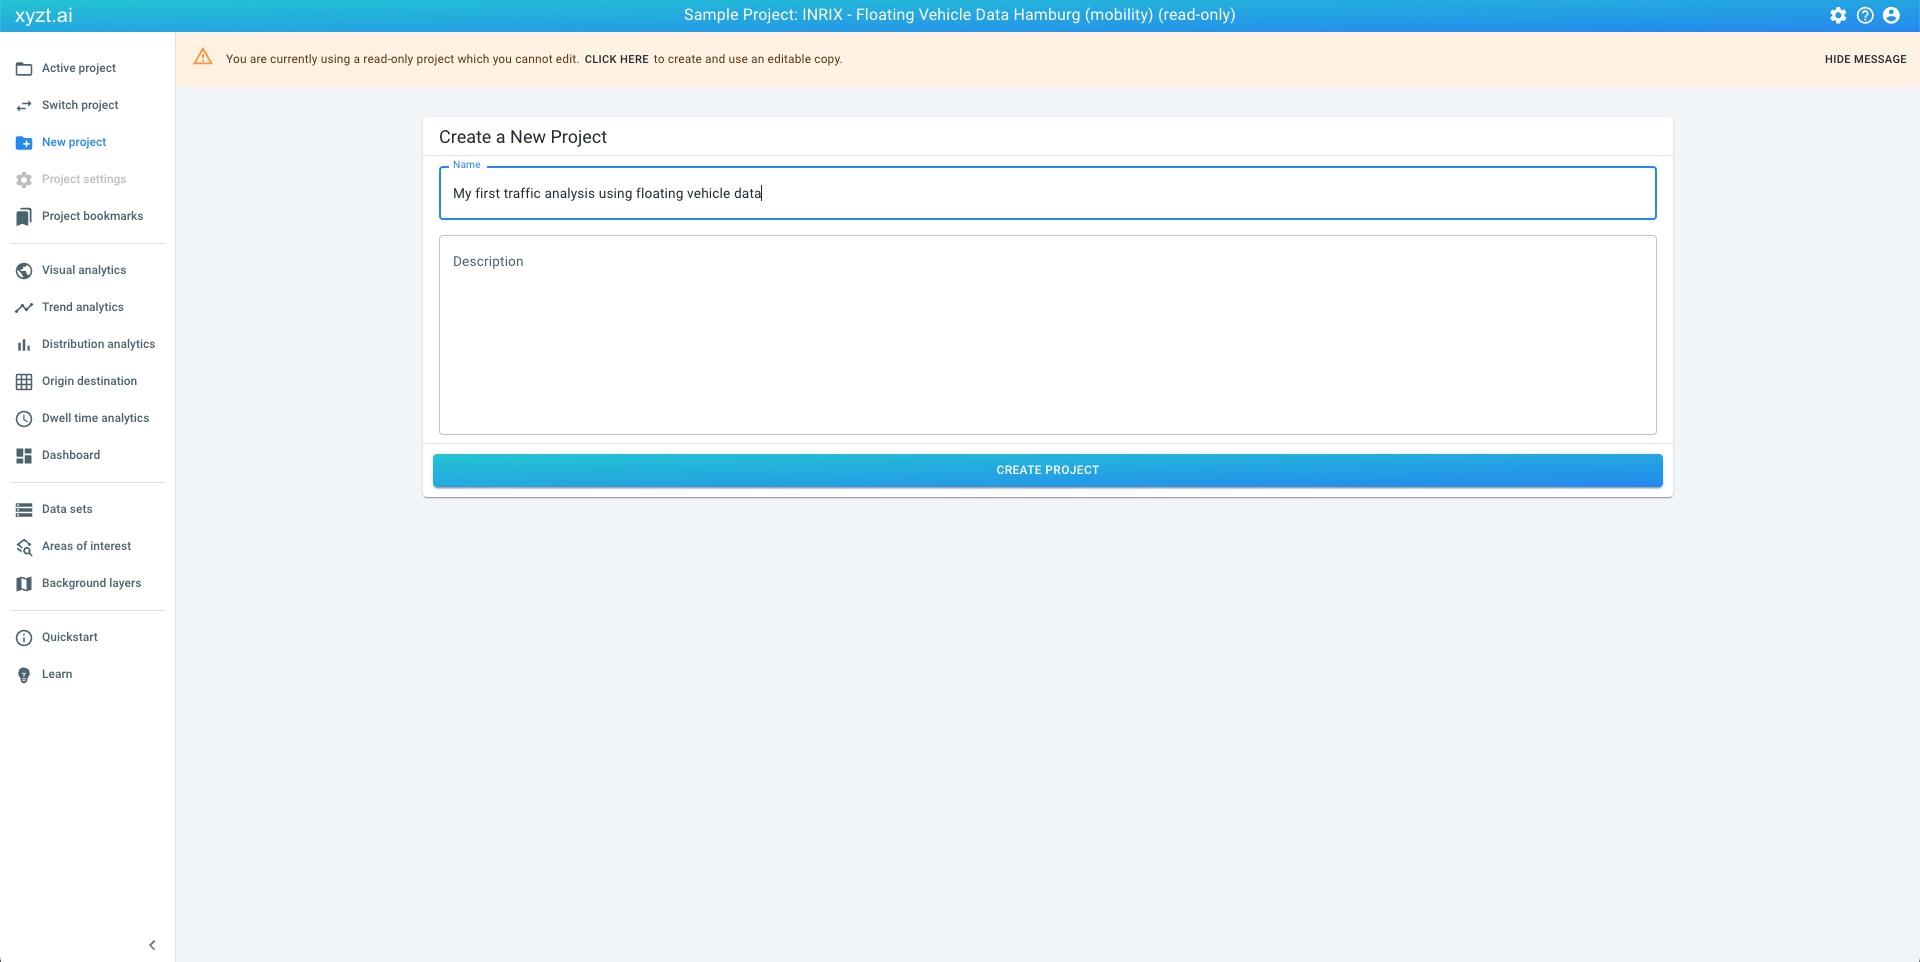
Click on New project on the navigation bar on the left
-
Provide a name, e.g.,
My first traffic analysis using floating vehicle data, and an optional description.
Figure 1. Sample projects with example floating vehicle data from INRIX. -
On the following screen, we can start adding data sets, areas of interest, and background layers. Click on Data Sets.
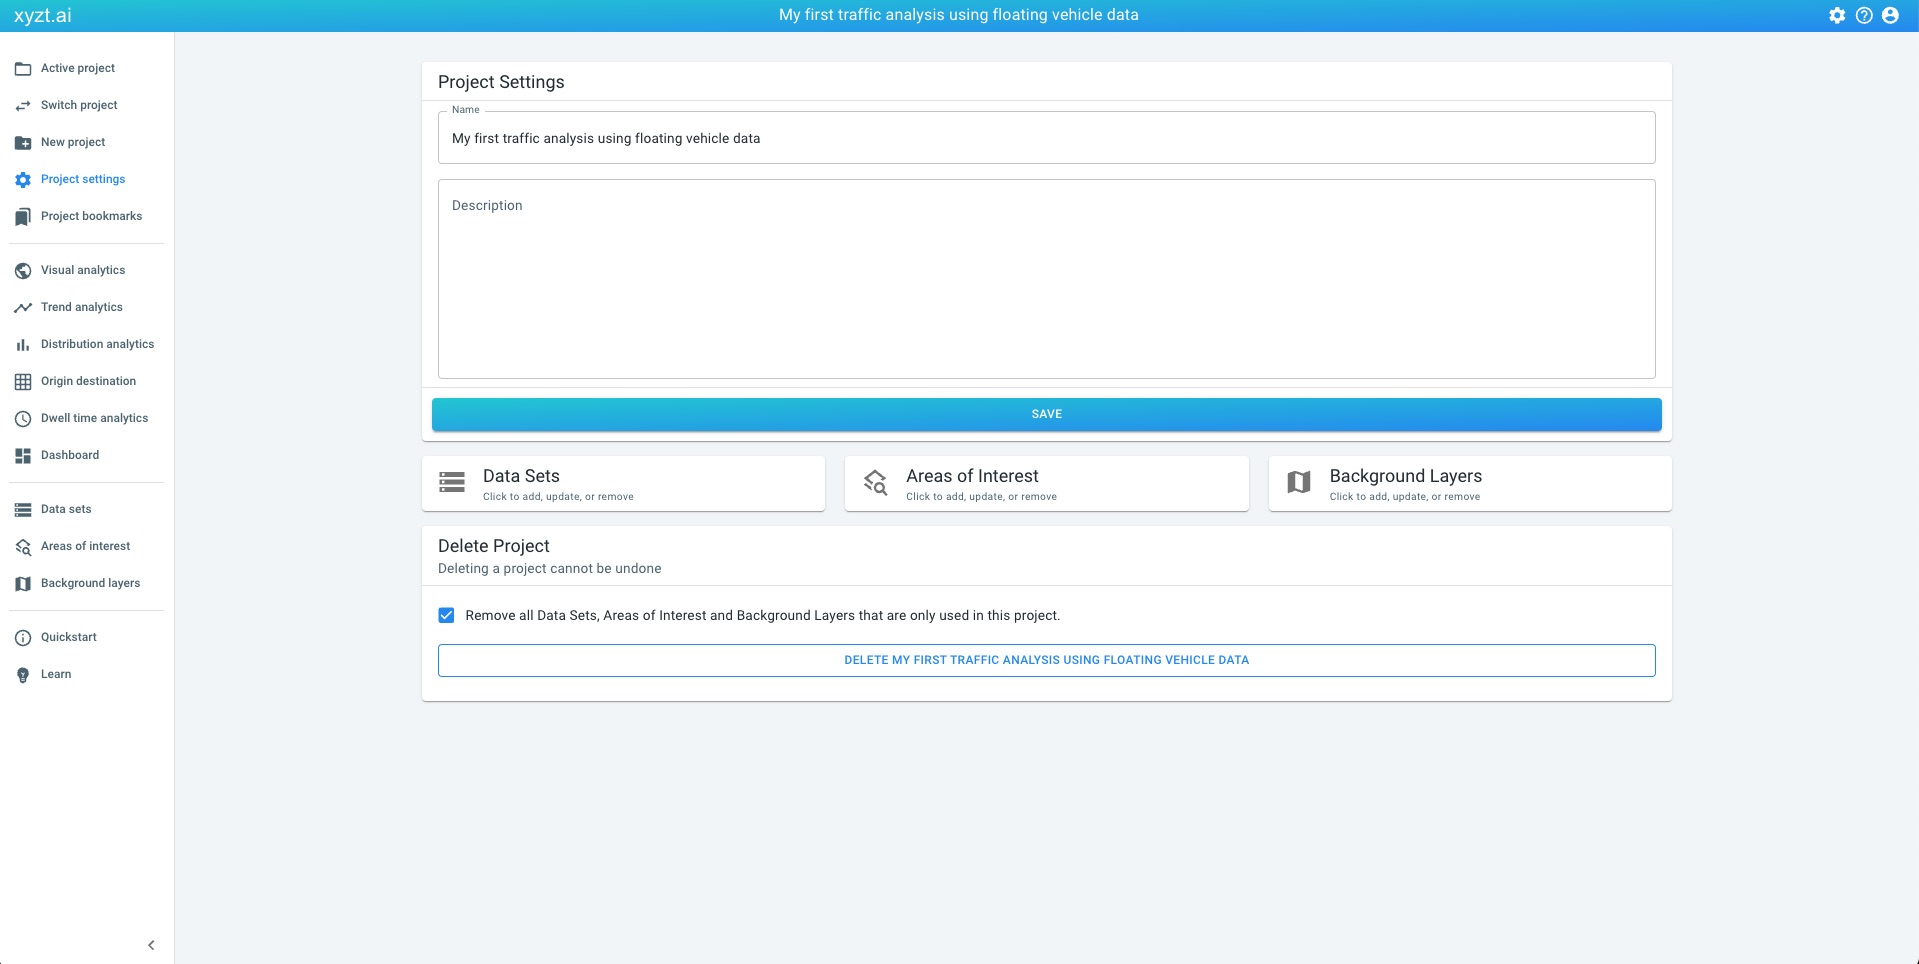 Figure 2. Project configuration page where you can add data sets, areas of interest, and background layers.
 -
Click on
SHOW LESSto hide the explanation text and make room -
Click on the 3rd tab: SAMPLE DATA SETS
-
Search for
INRIXusing the Search box at the top of the screen -
There can be multiple results, look for
Sample Data: INRIX -
Click on the ATTACH button of the
Sample Data: INRIXcard (you can find it in the lower right corner of the card).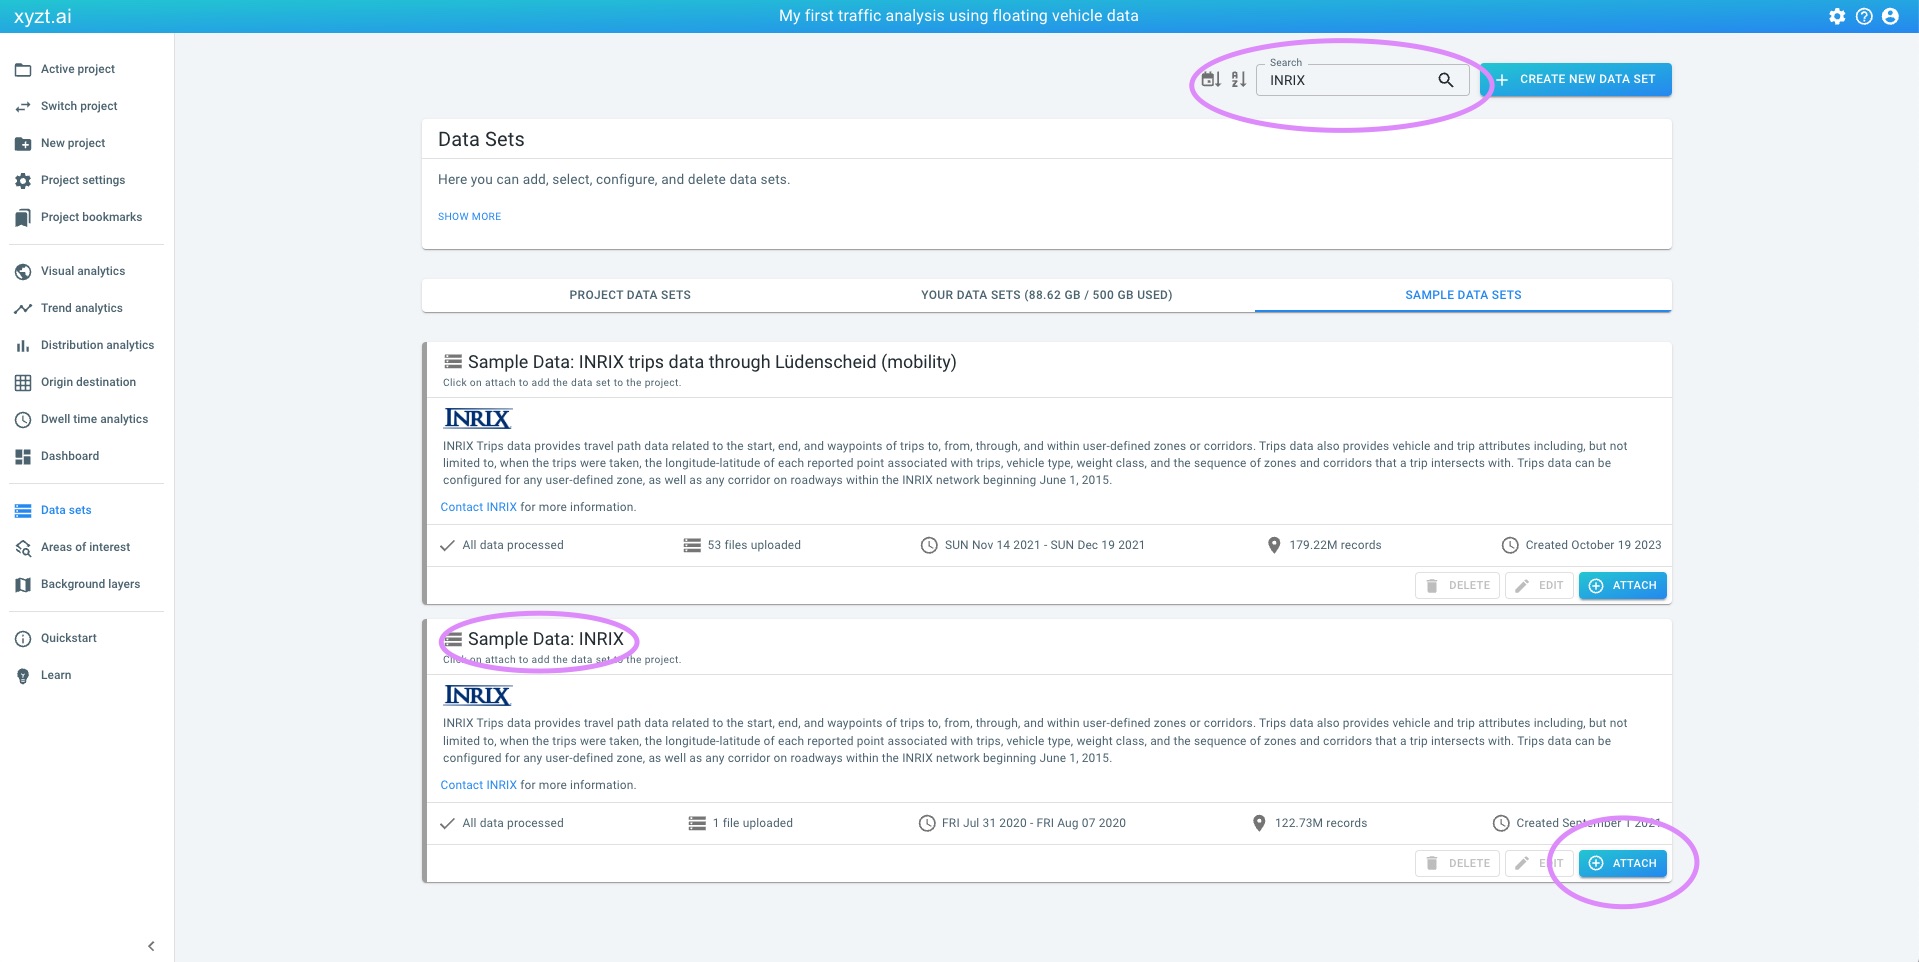 Figure 3. Attaching an existing data set to a project.
 -
Verify that the data set is now part of the project by clicking on the 1st tab PROJECT DATA SETS.
Let us also attach the background layers, to provide context during analysis. For this follow these steps:
-
Click on Background layers on the navigation bar.
-
Click on SAMPLE BACKGROUND LAYERS, i.e., the 3rd tab.
-
Attach both the Dark and the Satellite & Labels background layers by clicking on the ATTACH button on both cards. Note how the left border of the cards turn blue when attached.
You have now successfully set up a project with the INRIX floating vehicle trips data set.
You can verify whether all your layers are set up correctly by going to the Visual analytics page.
Next part
Go to the next part: Visual analytics
Got feedback? Additional questions? Just want to have a friendly chat?
Get in touch!