Got feedback? Additional questions? Just want to have a friendly chat?
Get in touch!
Available parts
- Goal
- Understanding floating vehicle data
- Create new project
- Visual analytics
- Trend analytics
- Origin-destination (current)
- Create a dashboard
- Sharing your insights
- Conclusion
Step 4: Using the origin-destination capability
Origin-destination analysis looks at how traffic flows between different areas. Each area can be both an origin and a destination.
Click on Origin destination in the navigation panel on the left.
Step 4.1: Look at how traffic flows between different neighborhoods in a city
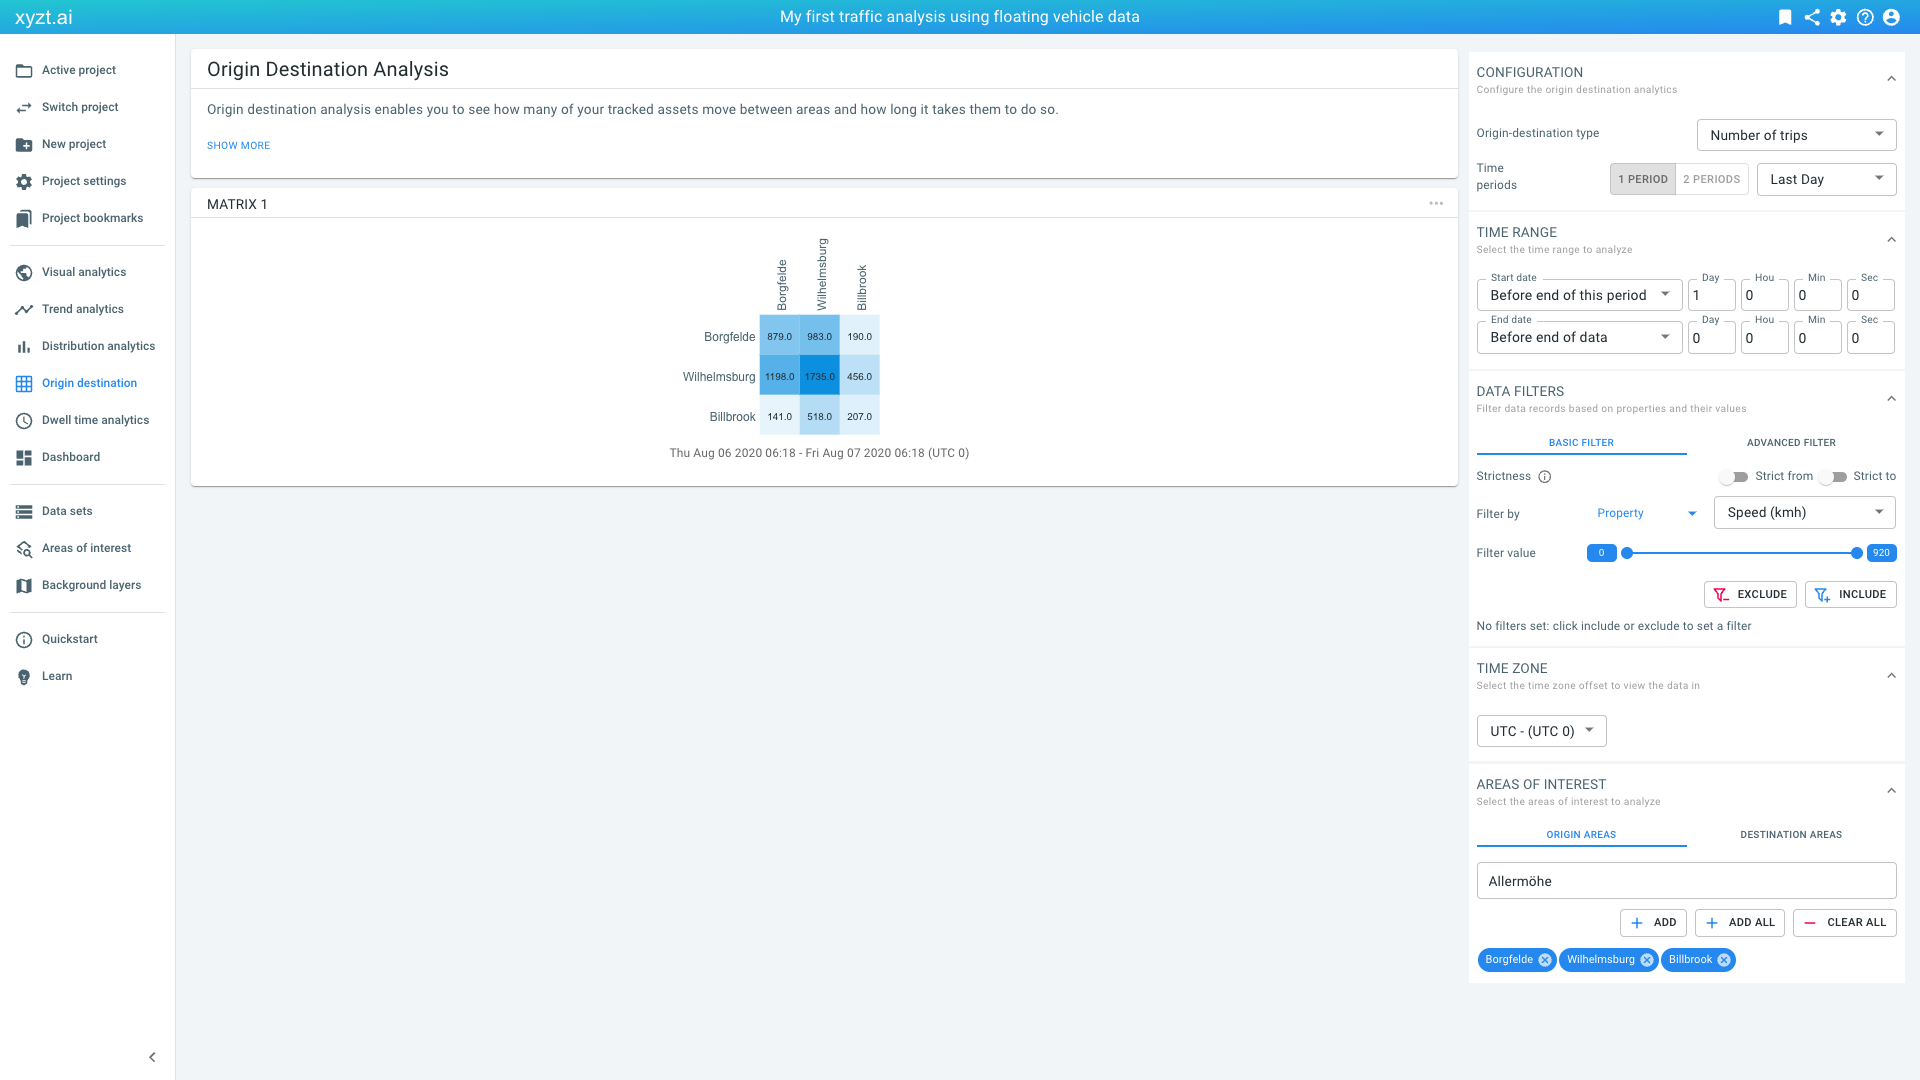
Similar to the Trend analytics, the first time you open this page, it will load with a number of default settings:
Figure 1. Default origin-destination view, comparing the last day with the day before.
-
It focuses on the last day in the data set.
-
It computes the
Number of tripsbetween all origin-destination pairs. -
It selects 3 areas or less from your drawing layers and uploaded GeoJSON shapes.
-
It shows absolute number of trips.
When analyzing two periods (you can do so by clicking on 2 PERIODS), the analysis for the first day is shown in the first matrix, the analysis for the second in the second, and the third matrix shows the difference.
Step 4.2: Understand origin-destination matrices and the different visualization modes
Let’s look in more detail what the origin-destination analysis can teach us. For this, let’s focus on the two areas we have been working with: Our own created Highway 1 shape and the uploaded Steinwerder shape:
-
Click on 2 PERIODS in the CONFIGURATION panel on the top right.
-
Select
Last Day vs Day Beforein the drop-down box next to it. -
Press CLEAR ALL in the AREAS OF INTEREST panel.
-
Search for
Highway 1and press ADD. -
Search for
Steinwerderand press ADD.
We should now see 3 matrices with dimensions 2x2 each.
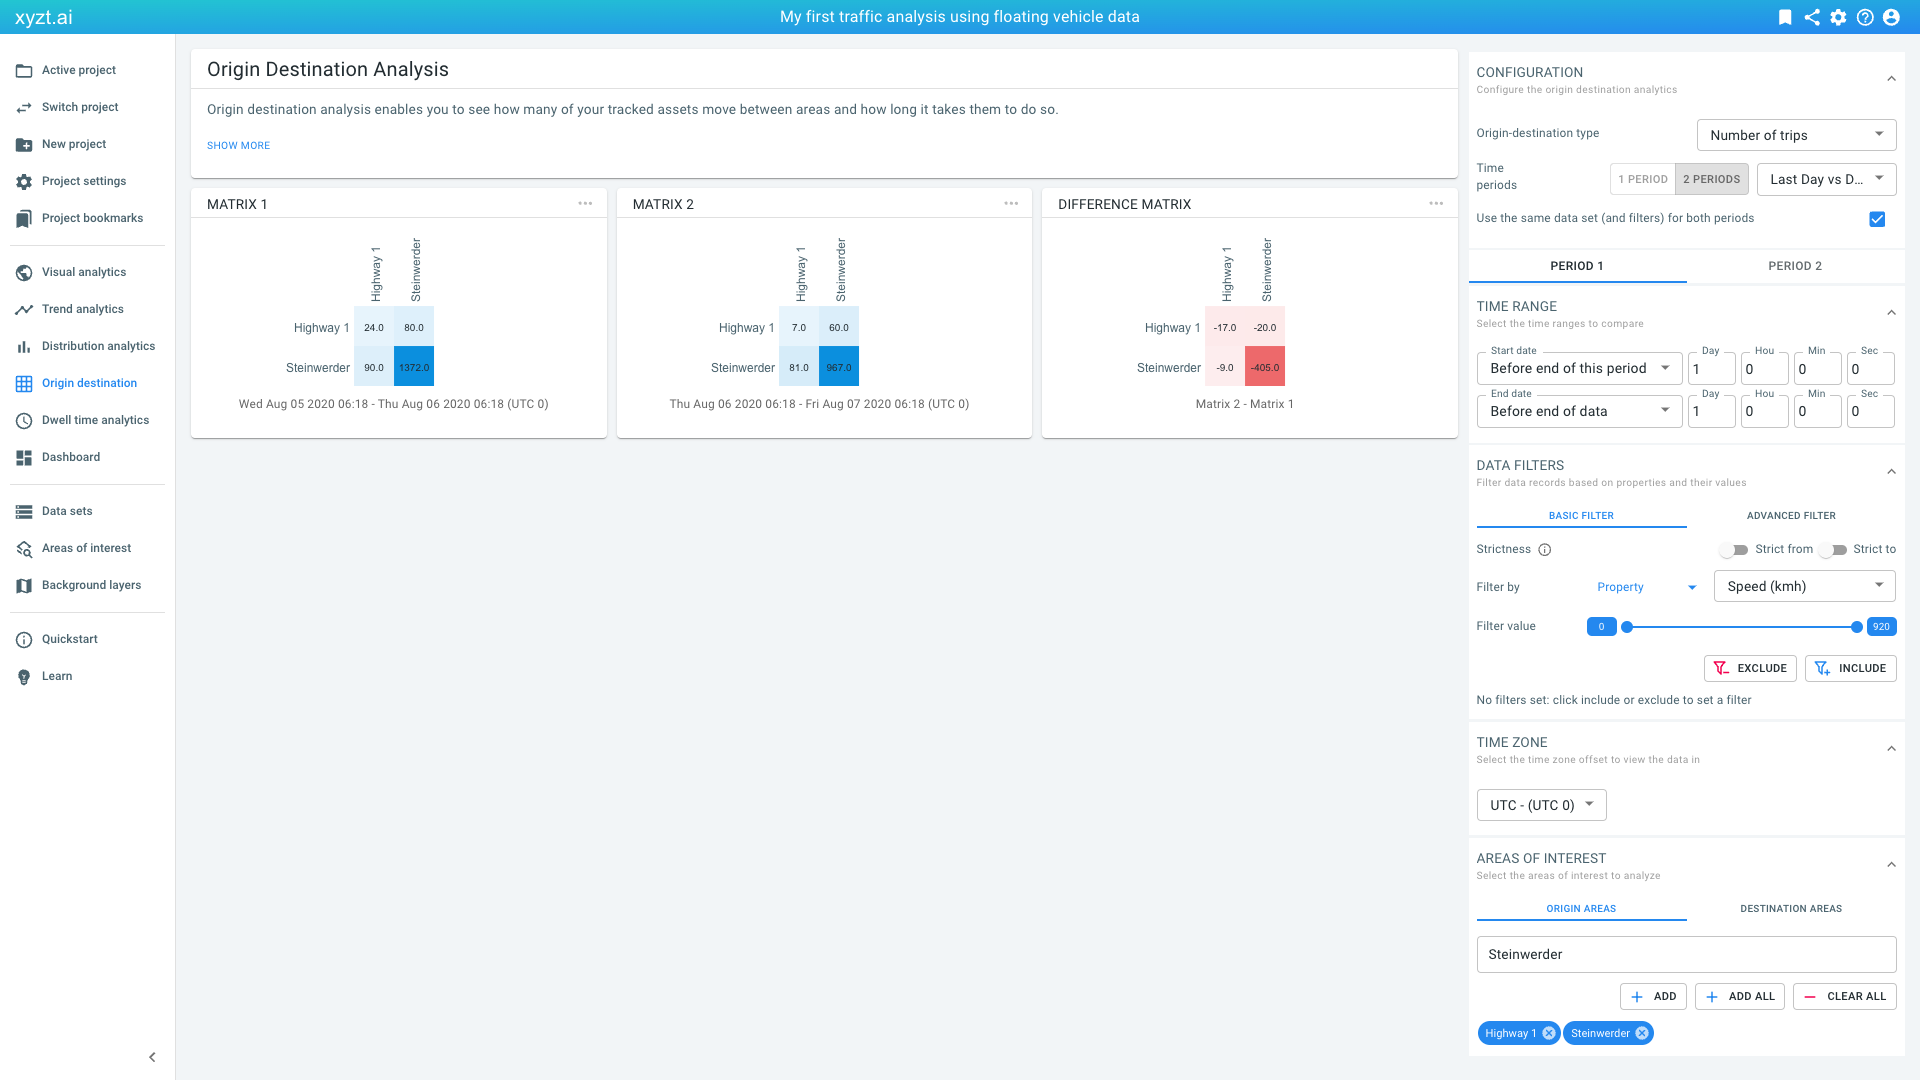
Figure 2. Origin-destination analysis for our own created area and the Steinwerder neighborhood.
On the first day, we see that there are 80 trips passing through Highway 1 and going to Steinwerder. On the second day, this number goes down to 60 trips. In the other direction, from Steinwerder to our Highway 1 area, we go from 90 to 81 trips.
These numbers are absolute numbers, and sometimes it is more informative to use percentages. To do so:
-
Select Percentage of trips (same origin) or Percentage of trips (same destination) from the dropdown box in the CONFIGURATION panel on the top right of the page, next to Origin-destination type.
You can now see what percentage of trips start or go to a certain area.
Step 4.3: Learn how to compute travel times and change in travel times between different regions
Let’s look how travel times differ between Steinwerder and our Highway 1 area and vice versa and how they changed between the two days.
For this select Average travel time from the dropdown box in the CONFIGURATION panel, next to Origin-destination type.
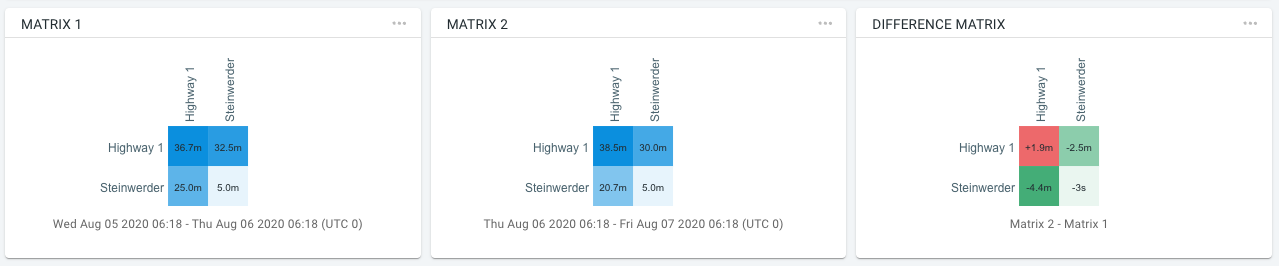
Figure 3. Travel time analysis on the origin-destination page.
You should now observe the following:
-
Traveling from Steinwerder to Highway 1 took 25 minutes on the first day and 20.7 minutes on the second day.
-
Traveling in the other direction is slower around 30 minutes.
Let’s bookmark this analysis by clicking on the bookmark icon and naming it Step 4.3.
|
You can update bookmarks
When you loaded a bookmark before and try to create a new bookmark, the platform will ask you if you want to update the previously loaded bookmark. If you do not want to update, but instead create a new one, select CREATE NEW. |
Next part
Go to the next part: Create a dashboard
Got feedback? Additional questions? Just want to have a friendly chat?
Get in touch!