
Got feedback? Additional questions? Just want to have a friendly chat?
Get in touch!
Available parts
- Goal
- Step 0: Obtain data
- Step 1: Create data set
- Step 2: Define data structure (current)
- Step 3: Configure processing settings
- Step 4: Upload the csv files
- Step 5: Use your data set
- Further reading
Step 2: Define the structure of the data
At this point, you have created a new, empty data set. It does not contain any data yet, nor knows the platform anything about the structure and properties of the data.
First, you will define the structure of your .csv files:
-
The platform must know in which column the asset identifier is stored. This is the id of the asset (in this tutorial, the vessel) for which the movement records are defined.
-
The platform must know in which columns the location is stored (longitude, latitude and optional height).
-
The platform must know in which column the timestamp is stored.
-
If you want to analyze any additional properties, you also need to indicate in which columns those properties are stored and whether they are numbers, categorical properties (enumerations), or free strings.
Step 2.1: Navigate to the Configure Data Properties UI
by clicking on the Configure Data Properties button in the navigation bar
Figure 1. The navigation bar after clicking on the Configure Data Properties button.
Step 2.2: Gather information about your data set
Let us first understand the structure of the data that we will upload.
The AIS data that you are using in this tutorial is described here. The relevant information for us is:
-
The different columns in the CSV file: MMSI, BaseDateTime, LAT, LON, SOG, COG, Heading, VesselName, IMO, CallSign, VesselType, Status, Length, Width, Draft, Cargo, TransceiverClass
-
The EPSG reference system: EPSG:4269. This tells us how we should interpret the location coordinates.
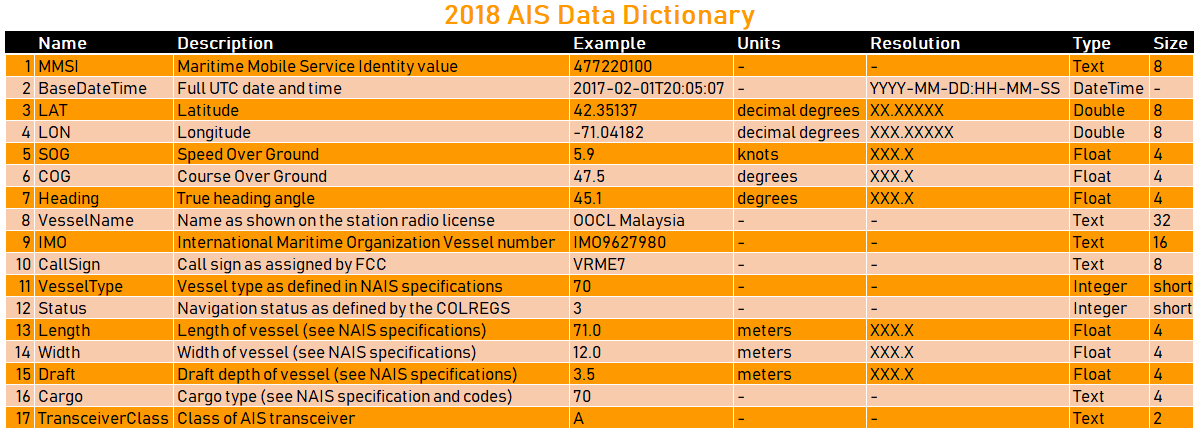
There is also an image with an overview of information and type of the different columns:
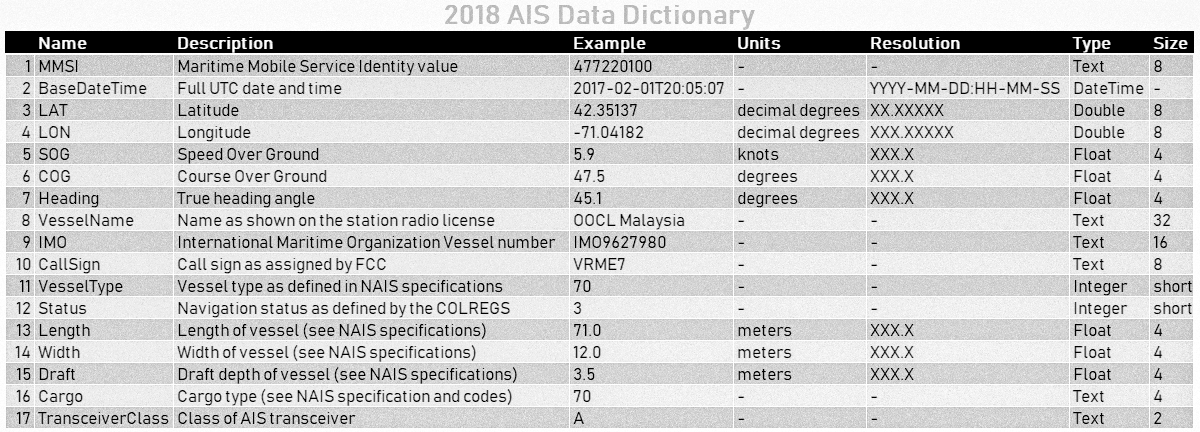
Figure 2. Overview of the different columns in the AIS data (source).
|
Auto-detect the available properties
When you don’t know which properties are present in your file, you can also upload the file to inspect and select which properties you want to include. See this article for more information. |
Step 2.3: Use the wizard to configure the required properties
Now that you have all the information about the data set, you can provide this info to the platform. This tutorial uses the wizard for this.
Right now, the wizard contains the required properties, but still uses an invalid column index:
-
The identifier column: each row in the
.csvfiles represents a recorded location of a ship. The platform can associate that location to a specific ship by looking at the unique ship identifier that is present in each row. -
The location columns: each row contains a longitude and latitude coordinate. The platform needs to know in which columns these are stored.
-
The timestamp column: each location is recorded at a specific time. The platform needs to know which column contains that timestamp.
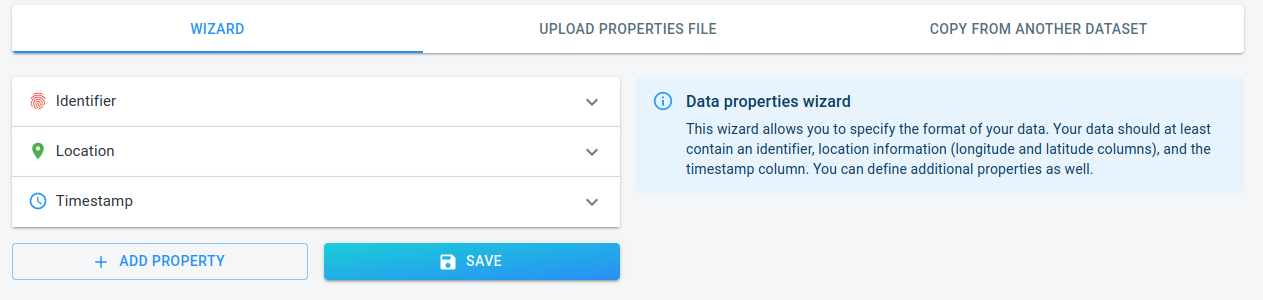
Figure 3. The wizard with all the required properties that still need to be configured
|
The wizard has context-sensitive help messages
The info box on the right-hand side of the wizard contains some additional information. This information updates based on the property you are currently editing. |
Identifier
The identifier in our data set is the MMSI (Maritime Mobile Service Identity) value. An MMSI uniquely identifies a vessel. As listed in our data schema, this value is stored in the first column as a string.
Click on the Identifier button in the wizard and add that information to the correct fields:
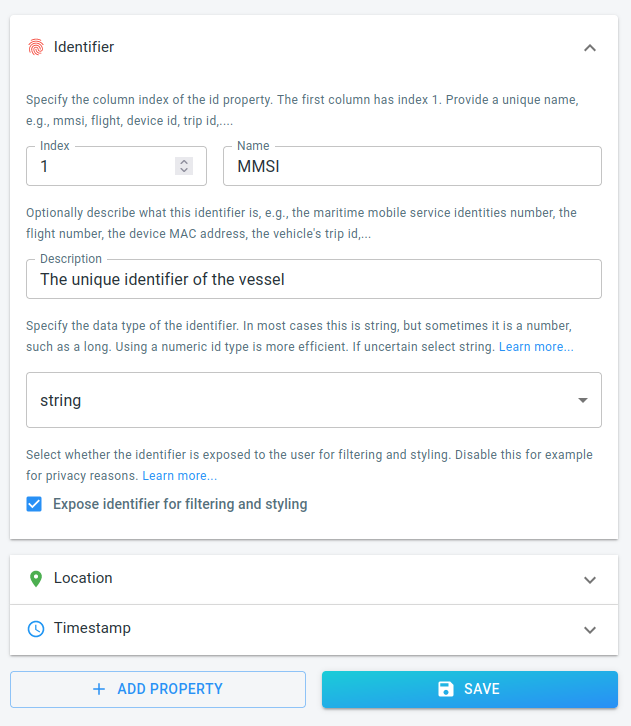
Figure 4. The wizard with all the information for the Identifier property completed.
Location
Follow the same steps for the location.
-
The Latitude is stored in column 3.
-
The Longitude is stored in column 4.
-
The reference system is EPSG:4269.
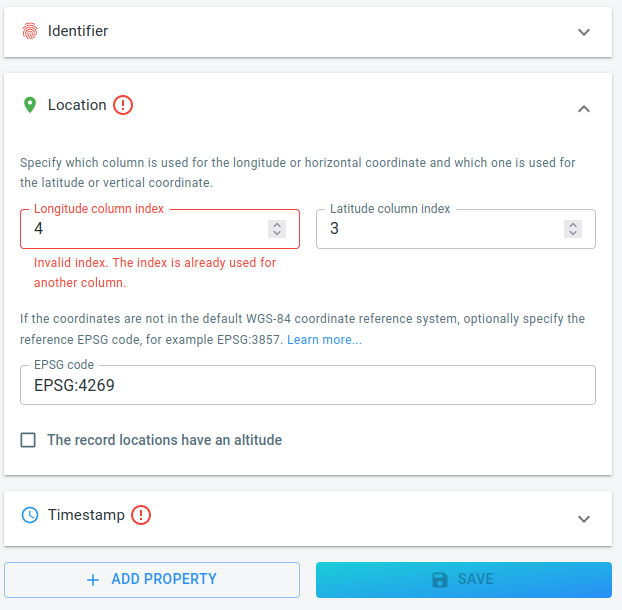
Figure 5. The wizard with all information about the Location.
Timestamp
Repeat once more for the timestamp, which is stored in column 2. As soon as you indicate that the times are stored in column 2, all the errors disappear and the SAVE button becomes enabled.
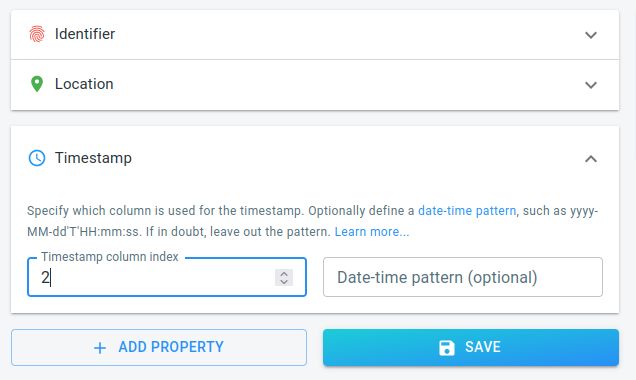
Figure 6. The wizard with the timestamp configured, and the error fixed.
The times are stored using a standard string representation (YYYY-MM-DD:HH-MM-SS), so there is no need to define a custom pattern. The platform will try to auto-detect the date-time format if the date-time pattern is left empty.
Step 2.4: Use the wizard to configure additional properties
If you stopped here, you will only have access to the location and timestamps during analysis. Most likely, you will want to make some additional properties available.
For this tutorial, you can for example add:
-
The name of the vessel: available in column 8 as a string.
-
The vessel type: available in column 11. It is stored as a number, but those numbers represent an enumeration. For example number 30 means a fishing vessel, number 36 a sailing vessel, … (see here for an overview).
-
The draft of the vessel: stored in column 15 as a float.
|
More details about the type of the column available
If you are unsure what the data type for your column is, consult the help on the right-hand side of the wizard. We also have an additional article with more guidance available. |
The name
Press the ADD PROPERTY button at the bottom of the wizard, and fill in the details for this new property.

Figure 7. The wizard with the name column configured.
The vessel type
Press the ADD PROPERTY button again, and repeat. Only this time choose enum as data type for the column.
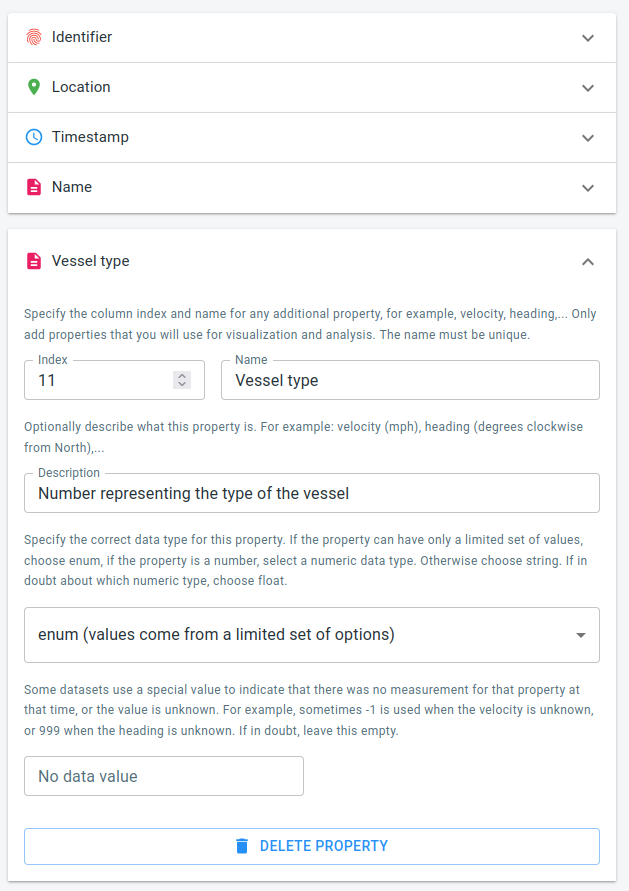
Figure 8. The wizard with the vessel type column configured.
The draft
Press the ADD PROPERTY button once more, and this time fill in the details for the draft property.
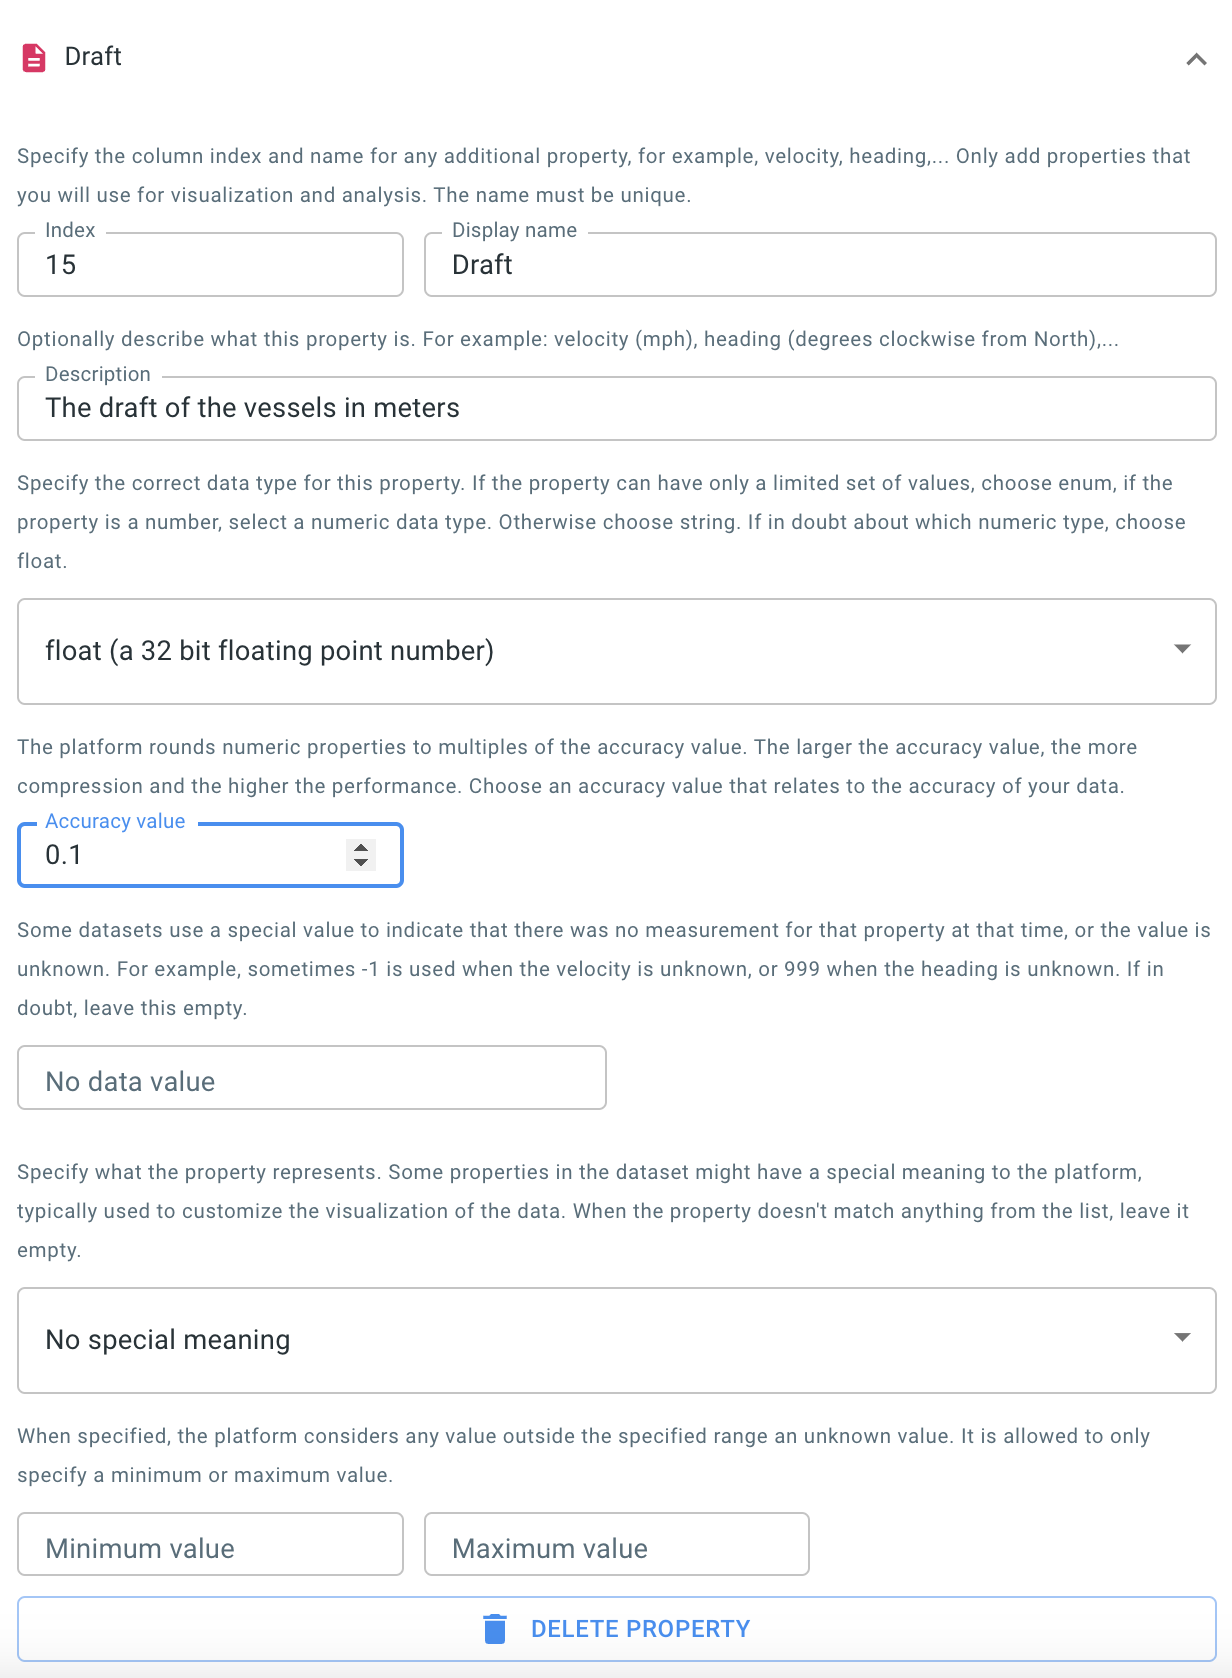
Figure 9. The wizard with the draft column configured.
As this is a numeric property, you also need to define an accuracy value, as shown in the screenshot.
The analytics engine rounds down numeric properties to the nearest multiple of the accuracy value. For example if you define the accuracy value for this draft property to be 0.1, the analytics engine will only use values with 1 digit behind the dot, rounding down a draft of 2.11 to 2.1, of 3.44 to 3.4, etc.
Typical accuracy values are 10,1,0.1,etc. as they relate to "number of significant digits", however, you can also use other accuracy values, such as 5, rounding down every value then to the nearest multiple of 5.
A good choice for the accuracy value depends on two things:
-
The accuracy you want to have available during the analysis.
-
The accuracy that is available in the data: if the vessel draft in the source data would only be reported with an accuracy of 1 meter, there is no point in choosing a smaller accuracy value.
Using larger values is beneficial for the performance and response times of the platform. For smaller data sets however, the impact of choosing a small value is negligible.
Step 2.5: Use the wizard to configure additional properties with a special meaning
When visualizing the trajectories of movement data you can choose to use an icon to represent the current position of the asset. This icon, for example a ship icon or a car icon, will be painted with the correct dimensions and in the correct direction when this information is available in the data.
This sample dataset contains:
-
A length and width property which indicate the dimensions of the vessel
-
A heading property indicating the direction the vessel is pointed at
Those are numeric properties, so you add them just like you added the draft property. Only this time you have to indicate that the property has a special meaning.
Note that AIS data uses a special number 511 to indicate when heading is not known. We can avoid using 511 as the heading degrees, by setting the valid range from 0 to 360.
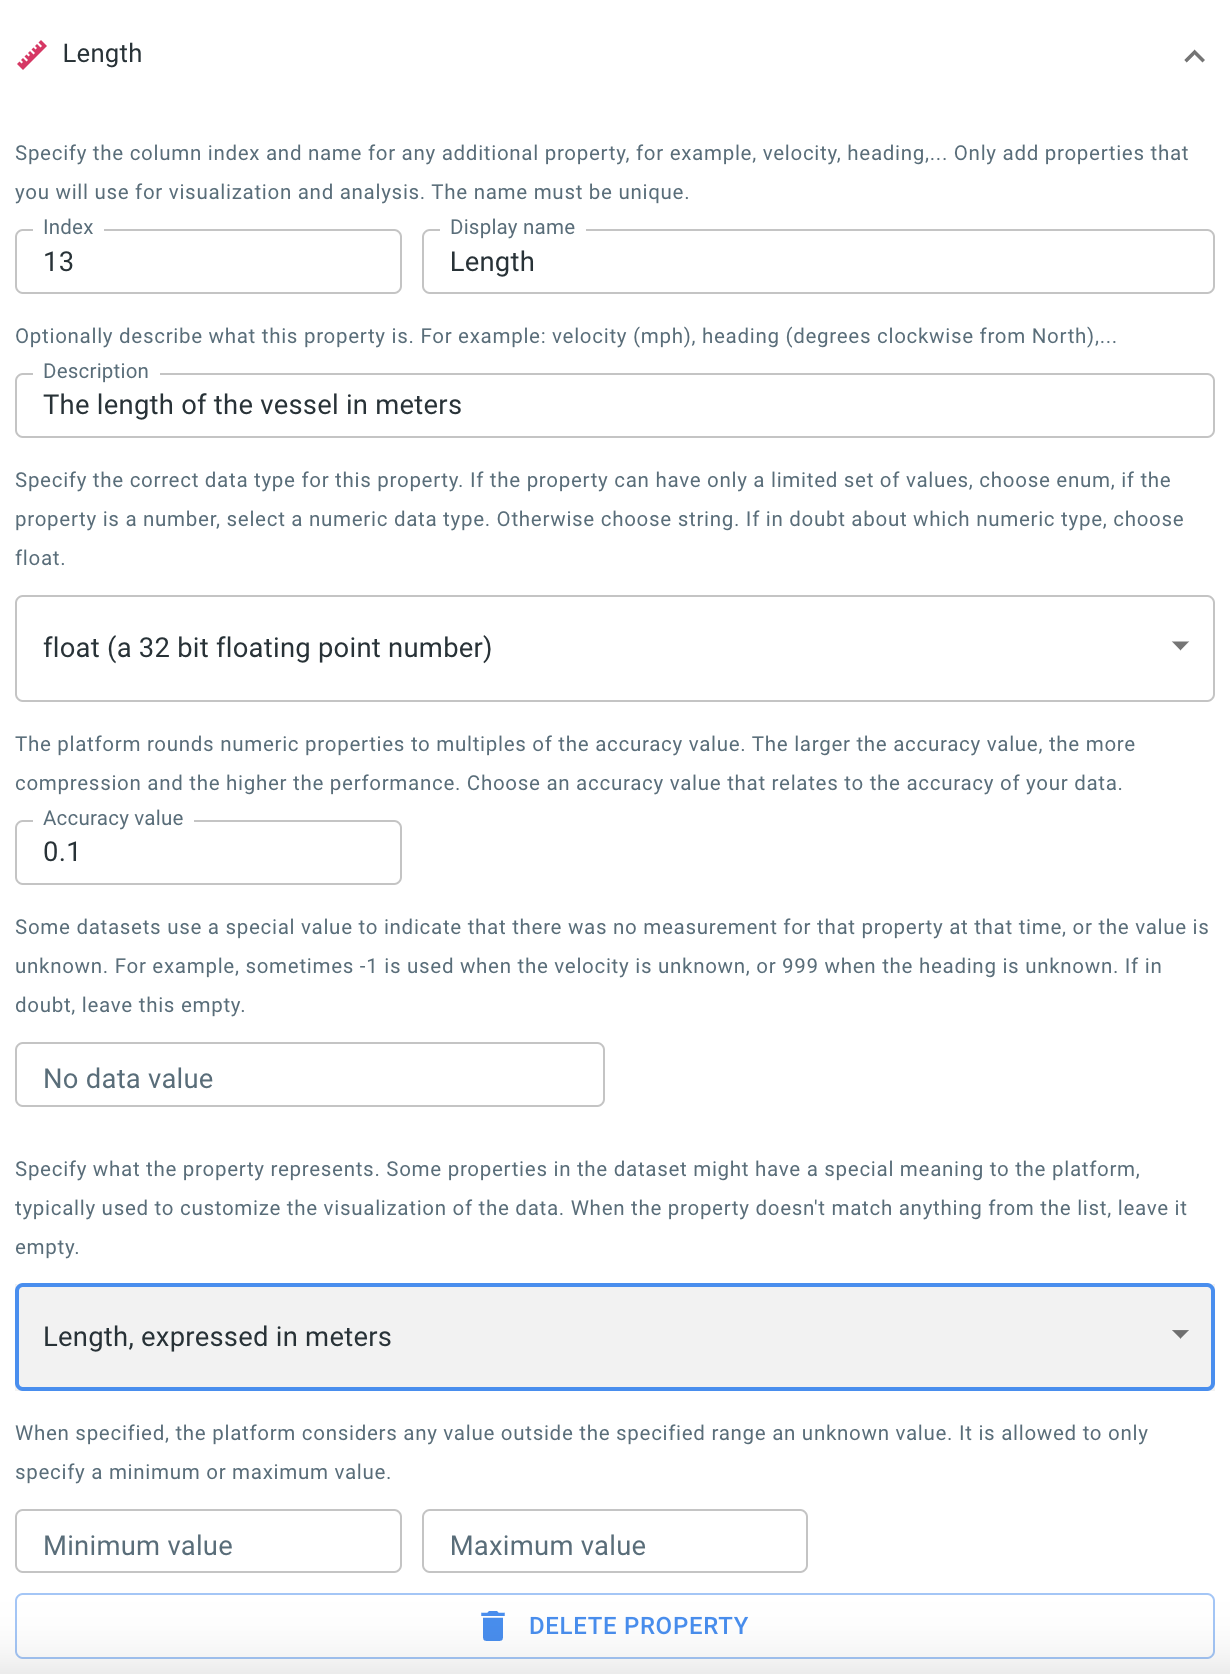
Figure 10. The wizard with the length column configured.
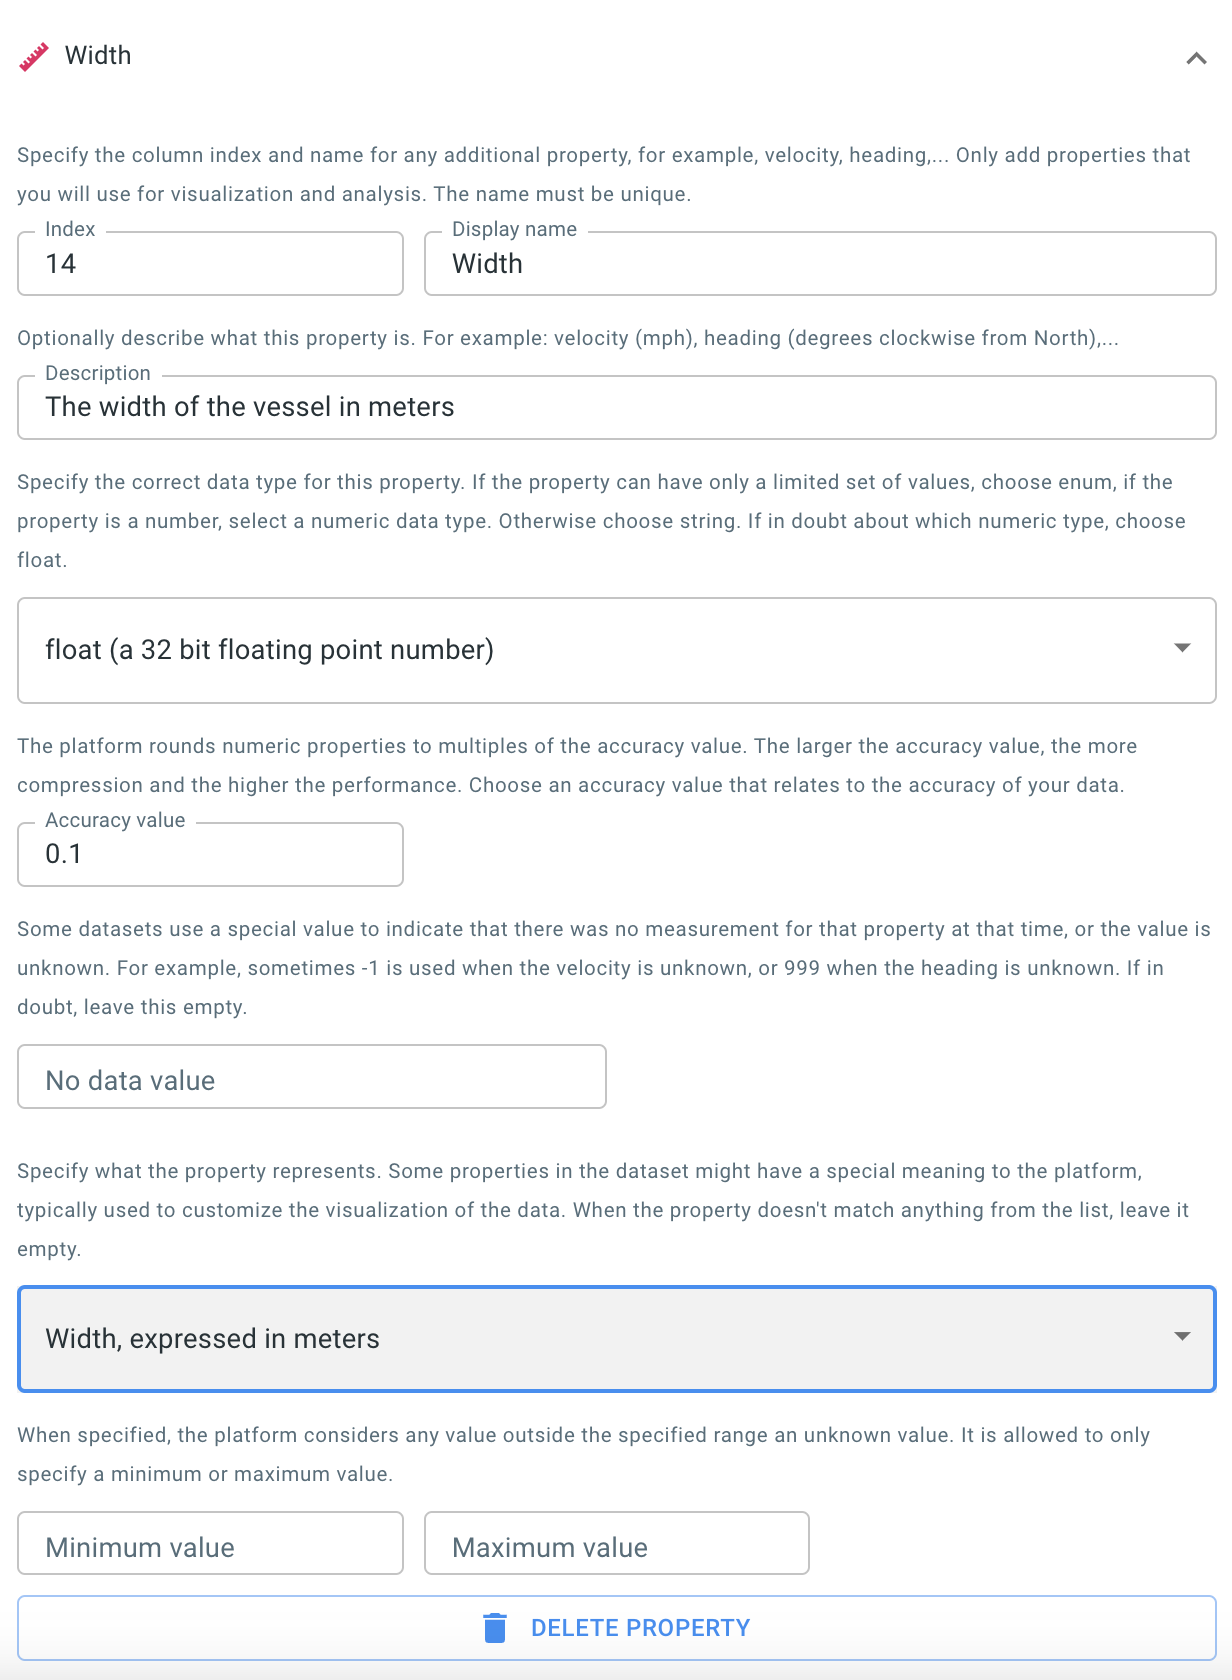
Figure 11. The wizard with the width column configured.
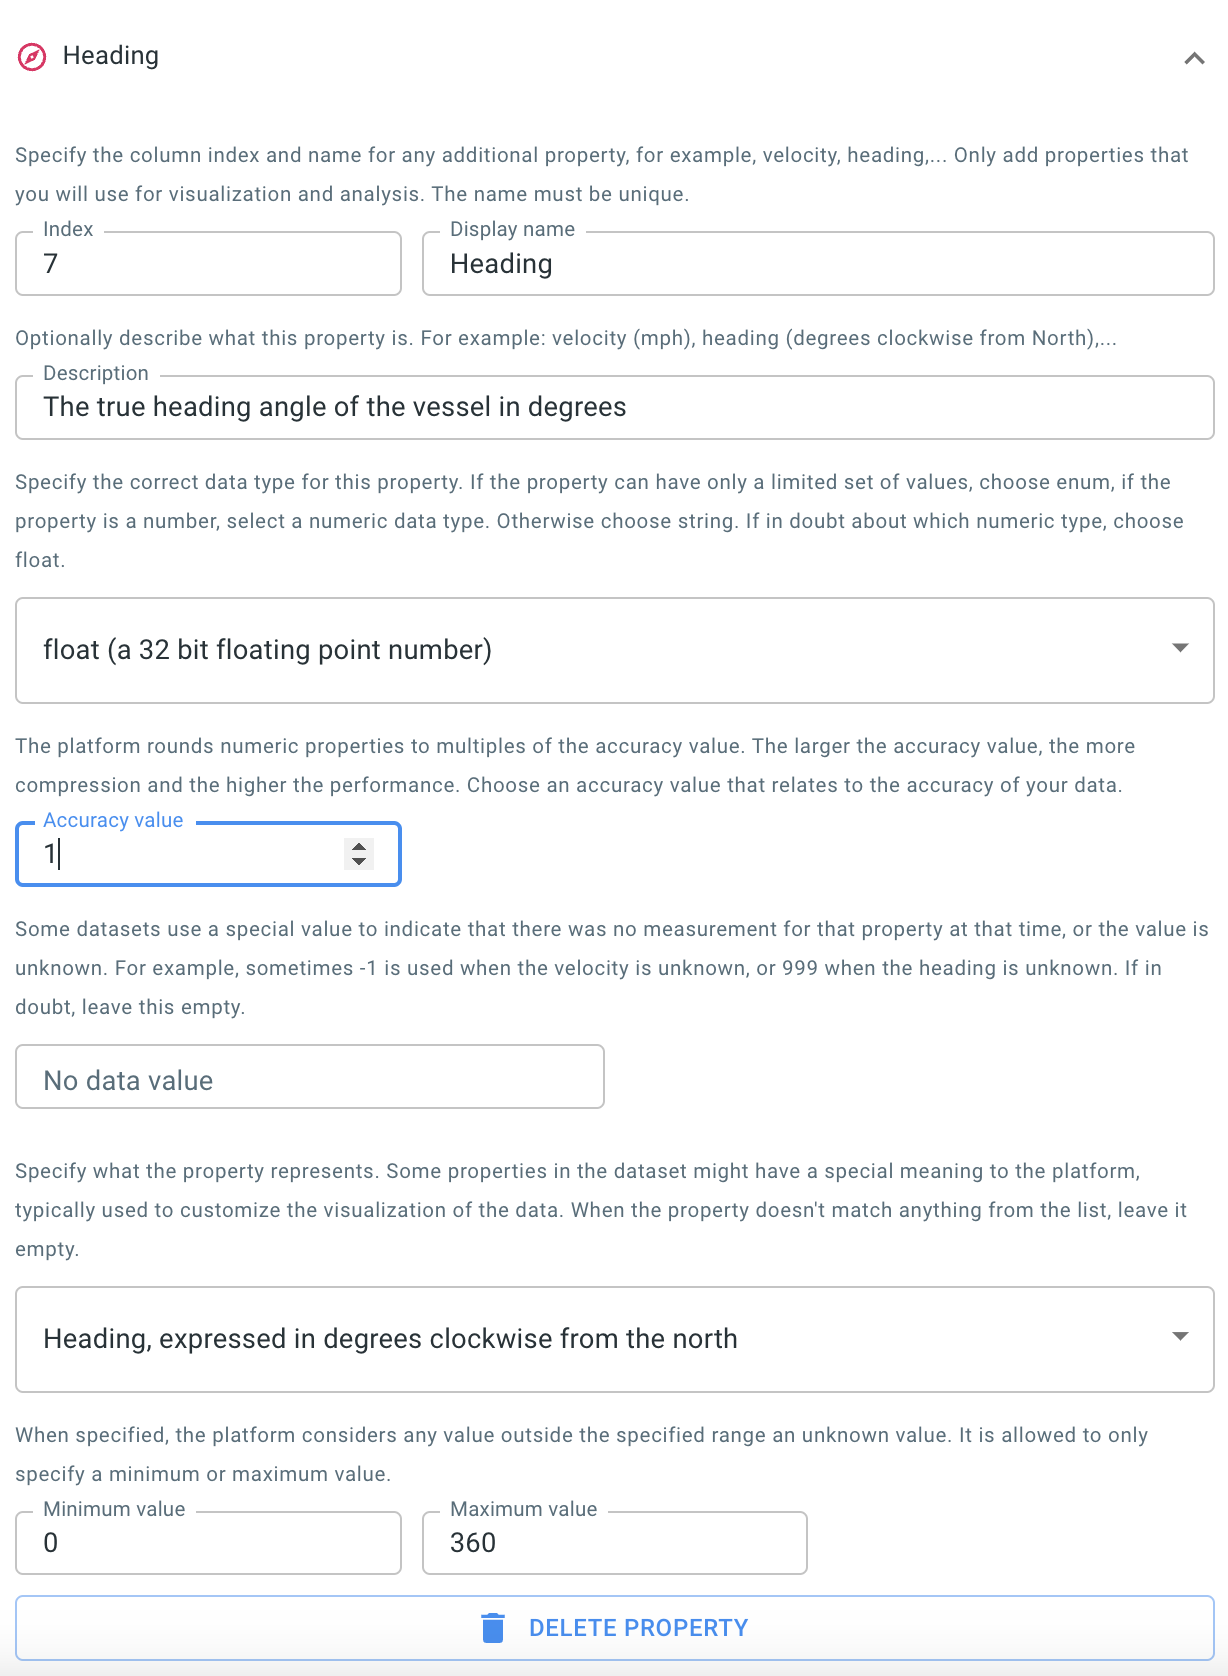
Figure 12. The wizard with the heading column configured.
The following screenshot shows an example on how this information is used when visualizing the data using icons:
Figure 13. Vessel icons on the map where the dimensions and the orientation of the icon is derived from the data
The Different data representations article contains instructions on how to activate the icons on the Visual Analytics page.
Step 2.6: Save the configuration
Now that you have filled in all the properties you want to have available for analysis, you still have to press the save button at the bottom of the wizard to save this configuration.
After you have saved the configuration, a table showing the properties of your data will appear underneath the wizard:
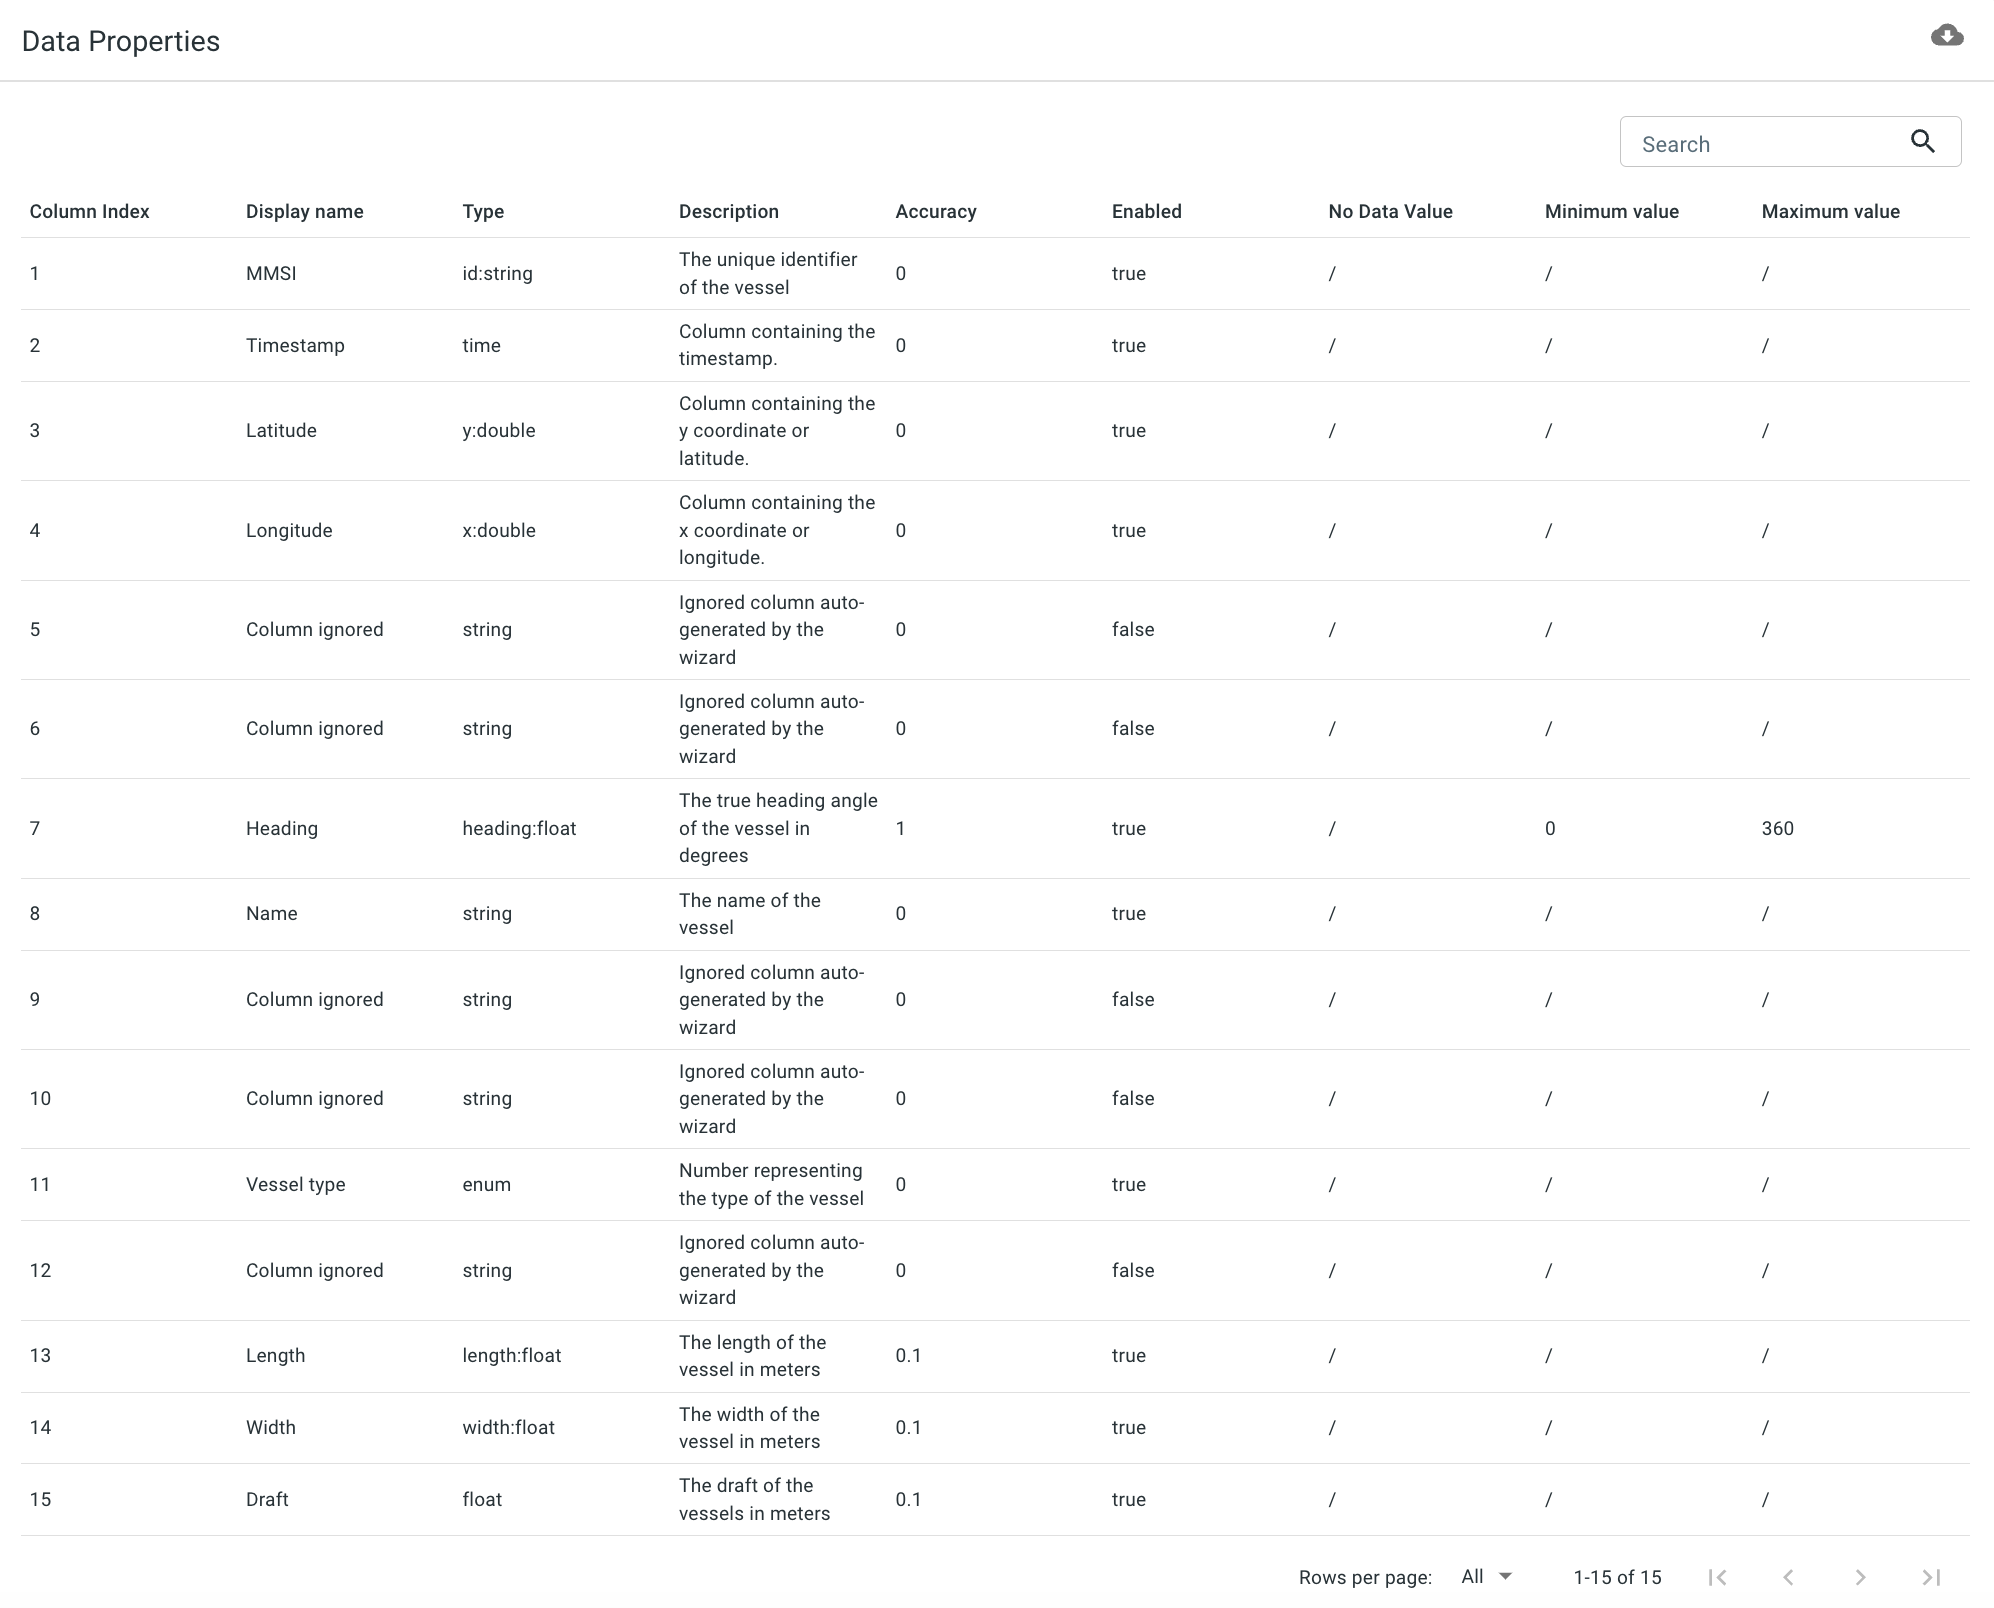
Figure 14. The properties of your source data, displayed underneath the wizard.
There are some things to note here:
-
The data properties overview shows more properties than you have configured. This is because you have indicated that the length property is contained in column 15. Now the platform knows your input data has at least 15 columns. The columns which you didn’t configure are present in the overview, but will be ignored.
-
At this point, it is still possible to change the properties. For example if you realize you made a mistake, you can still correct it. Once you start uploading data, it is no longer possible to make changes to the data structure.
|
Validating your properties
You can use the data validator on this page to verify if your data files match the defined properties. |
|
Other ways of defining your data
In this tutorial we use the wizard to define the structure of the data.
You can also define this in a separate file (in This is explained in more detail here. |
Next part
Go to the next part: Step 3: Configure processing settings
Got feedback? Additional questions? Just want to have a friendly chat?
Get in touch!