Got feedback? Additional questions? Just want to have a friendly chat?
Get in touch!
Available parts
Step 1: Create a new data set
What is a data set?
When you upload files to the platform, we will store them in a data set. Multiple files can be added to the same data set. You can have multiple data sets as well, for example:
-
One collection where the
.csvfile(s) contain air quality recordings and the.geojsonfile the location of the air quality sensors. -
One collection where the
.csvfile(s) contain the vehicle count on road segments and the.geojsonfile the location and shape of those road segments.
In this case, you would end up with two distinct data sets.
See this article for more information about data sets.
|
You can compress the files using gzip before uploading
The platform also accepts gzipped CSV and GeoJSON files. This enables you to first compress each individual file before uploading them to the platform, saving storage and upload time. Each file needs to be zipped individually. |
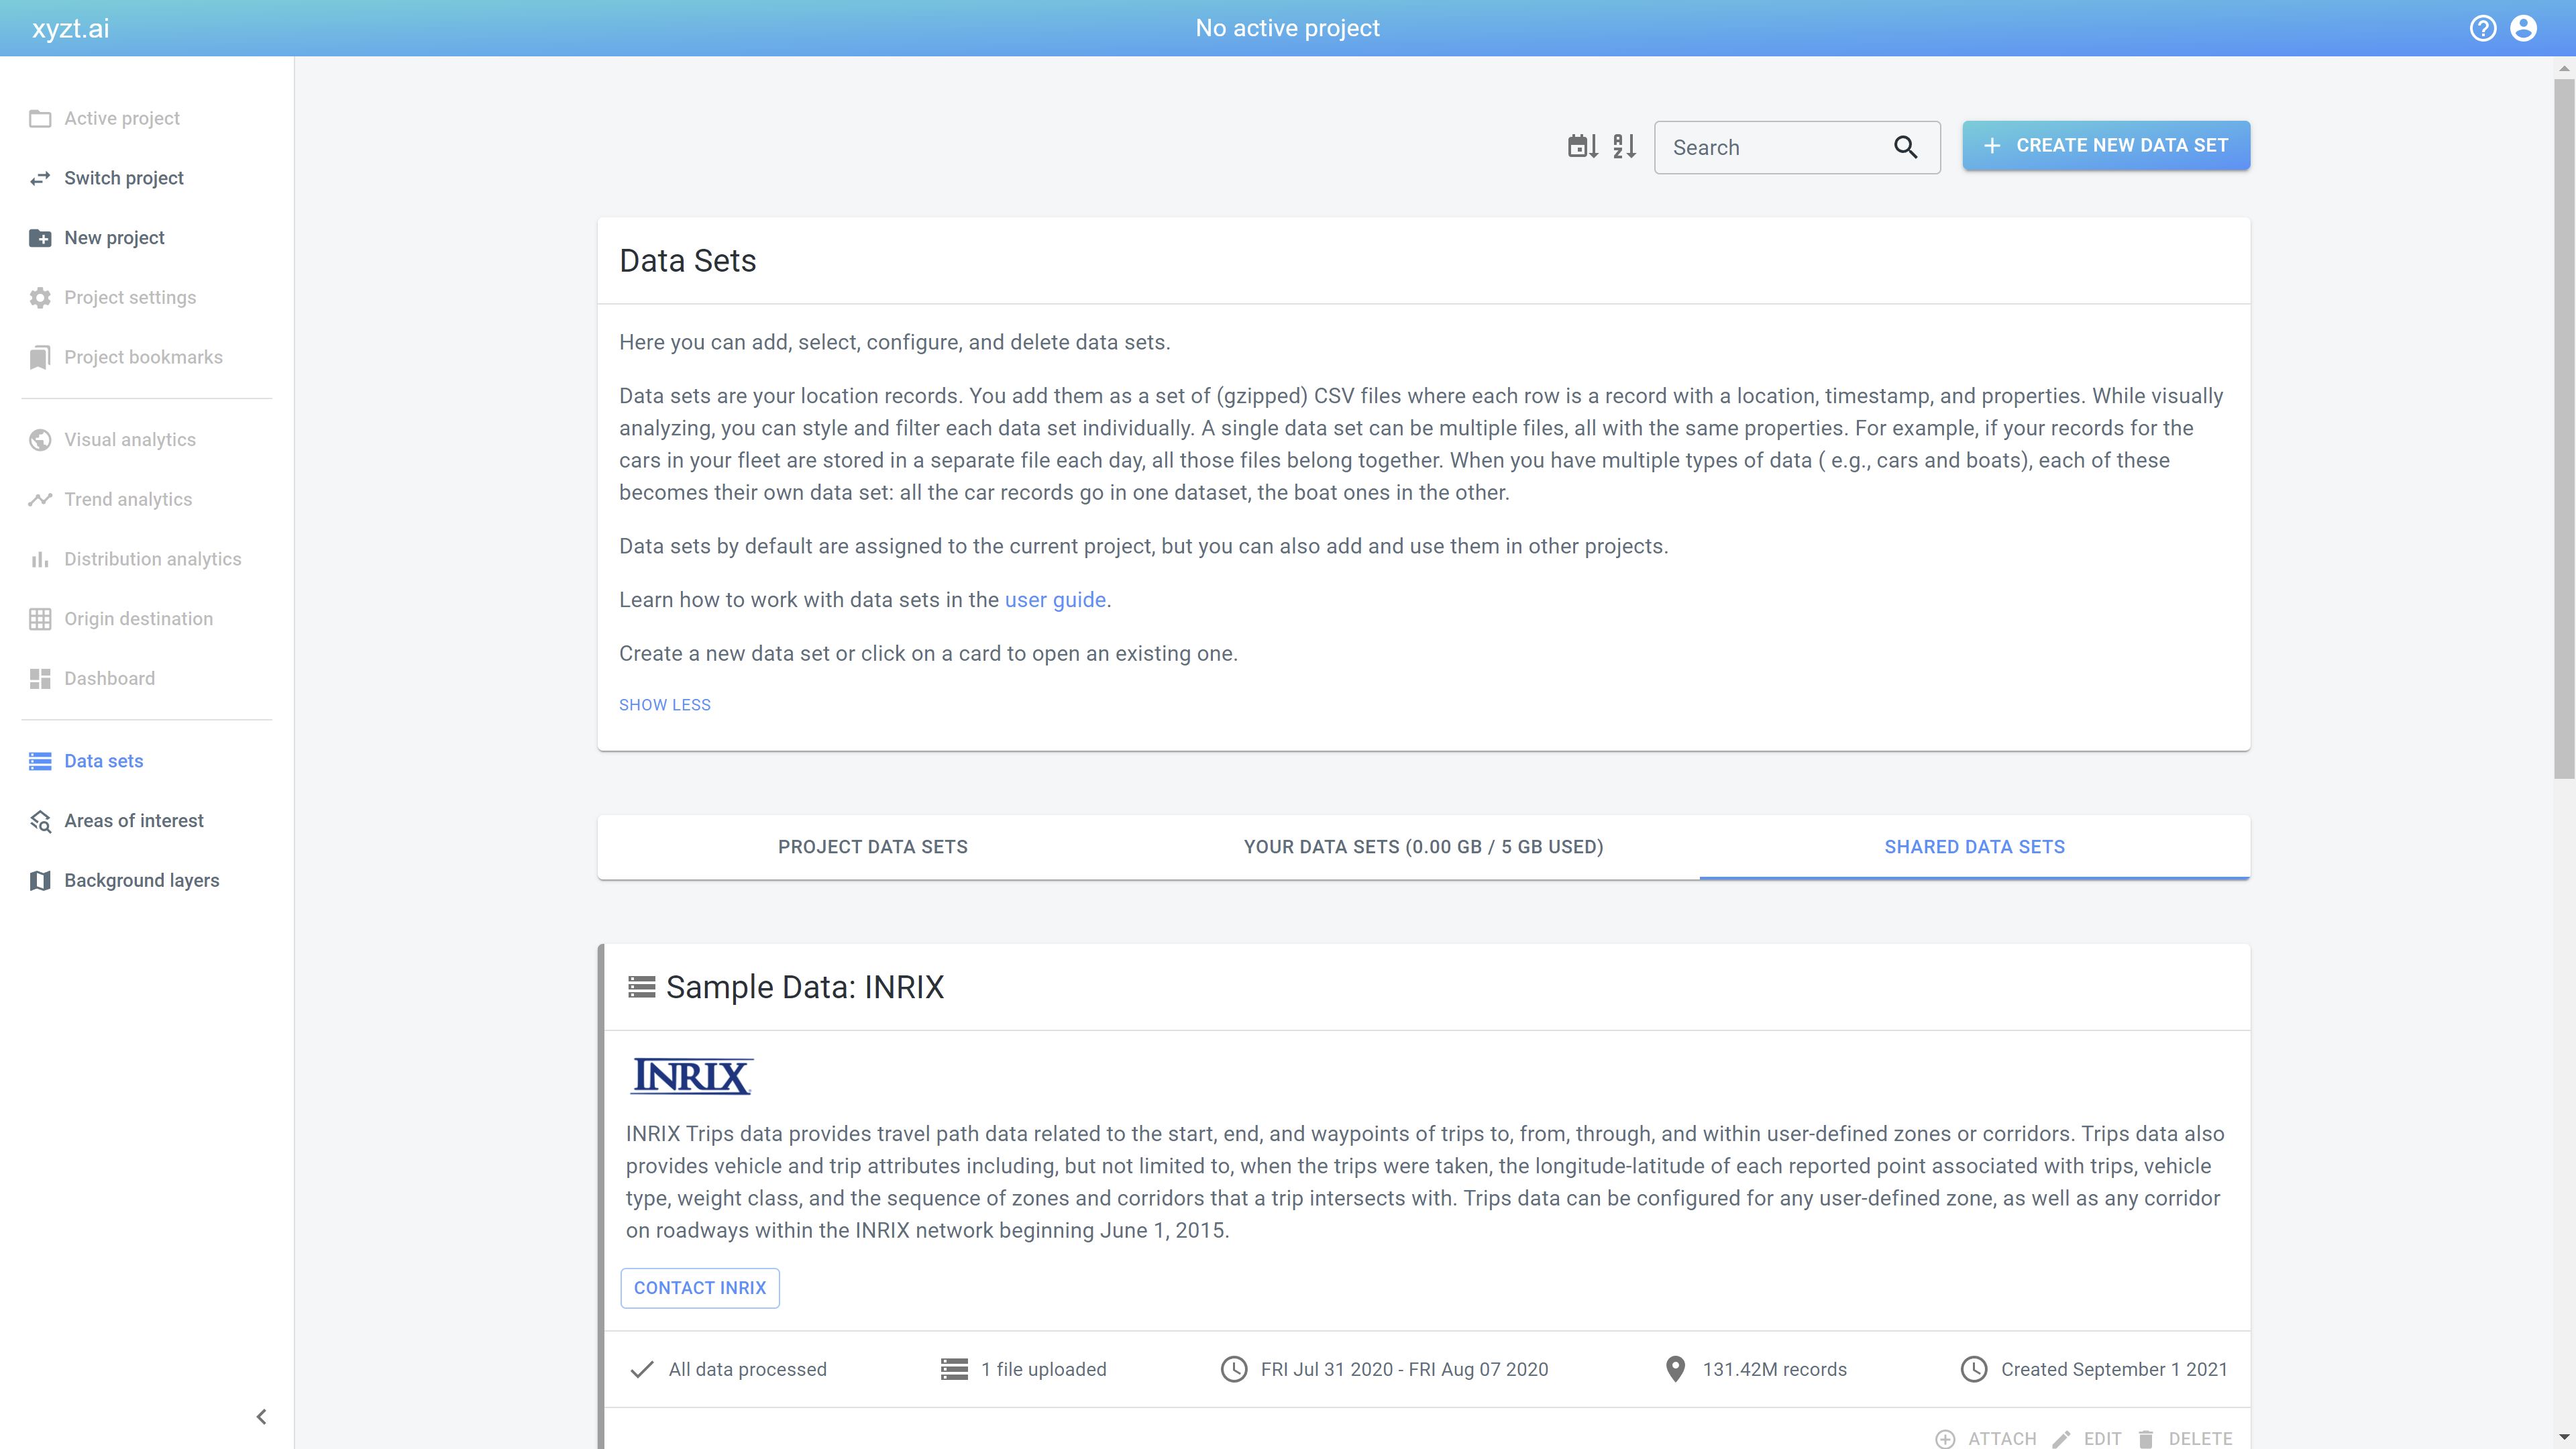
Step 1.1: Navigate to the 'New data set' page
by first clicking on the Data sets button in the left navigation bar
Figure 1. The data sets page shows an overview of all existing data sets and enables you to create new ones.
and then on the CREATE NEW DATA SET button in the top right corner of the Data sets overview page.
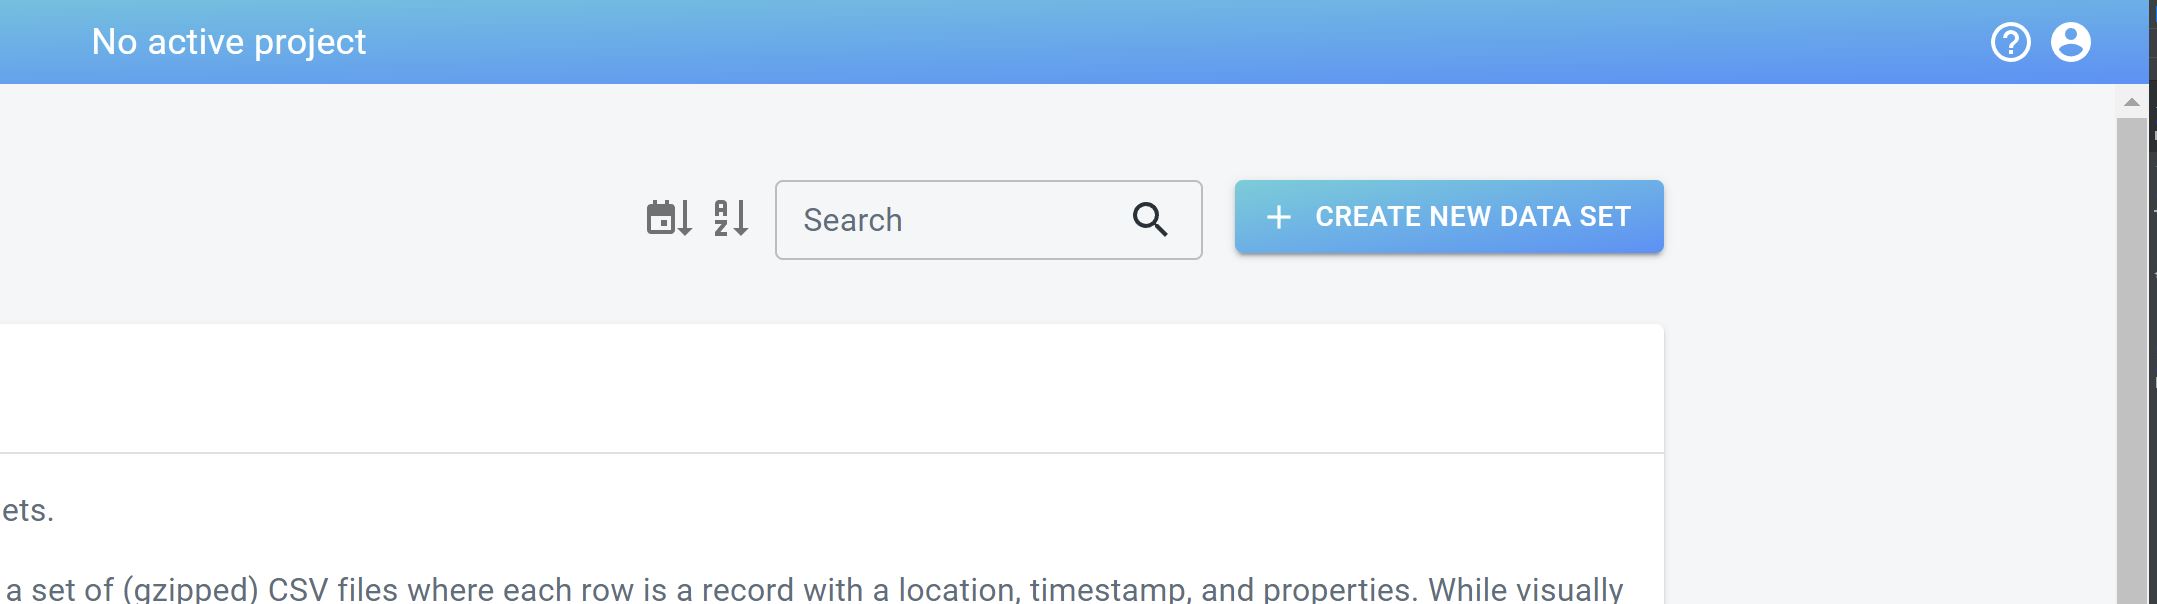
Figure 2. Create a new data set using the button in the top-right corner of the data sets page.
Step 1.2: Provide a name and description for your data set
Fill in the form to provide a name and description for your data set, for example:
-
Name:
New York Taxi Data -
Data type: here you select what kind of data you have. In this case, we’re working with Time Series Data .
-
Data file type: here you select in what format your data files are. In this case, we’re working with CSV files.
-
Describe what your shapes represent: here you describe what the shapes represent.
In this tutorial, we’re going to focus on the pick-up locations, so
pickup locationsis an appropriate choice. This name will be displayed in the UI elements of the different analytics pages, such as the Visual analytics page -
Description:
Information about the taxi pick-up and drop-off locations in New York, downloaded from
<a href="https://www1.nyc.gov/site/tlc/about/tlc-trip-record-data.page">this website</a>.
Note how you can use HTML tags to define the description.
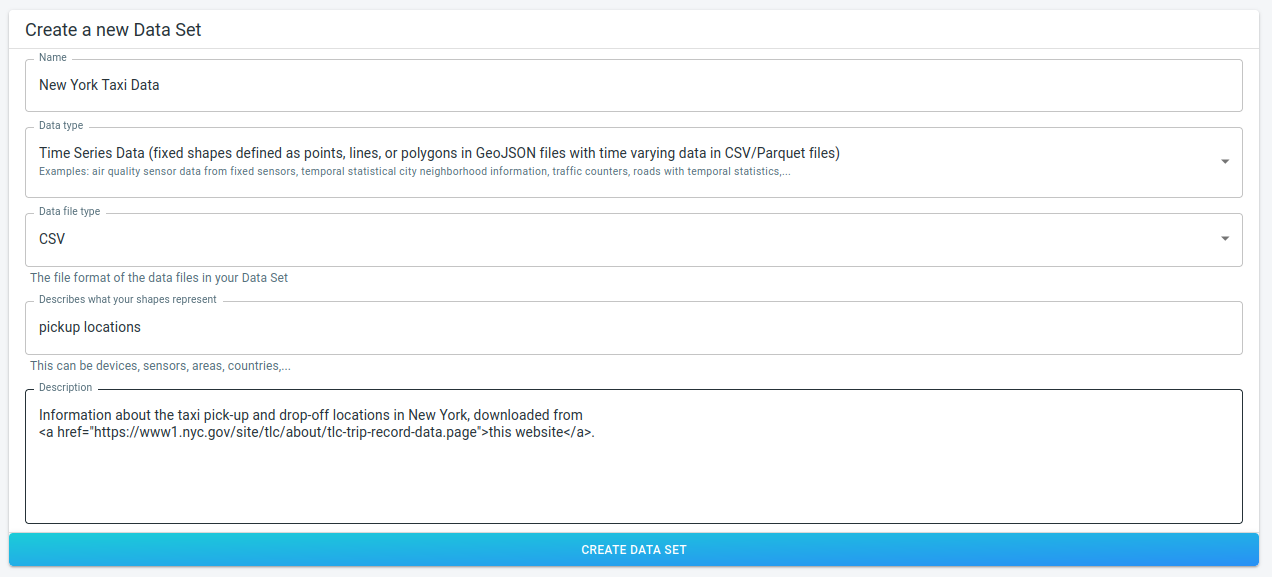
Figure 3. Creating a new time series data set
Once you filled in everything, press the CREATE DATA SET button.
This will bring you to the multi-step page where you need to provide all other required information.
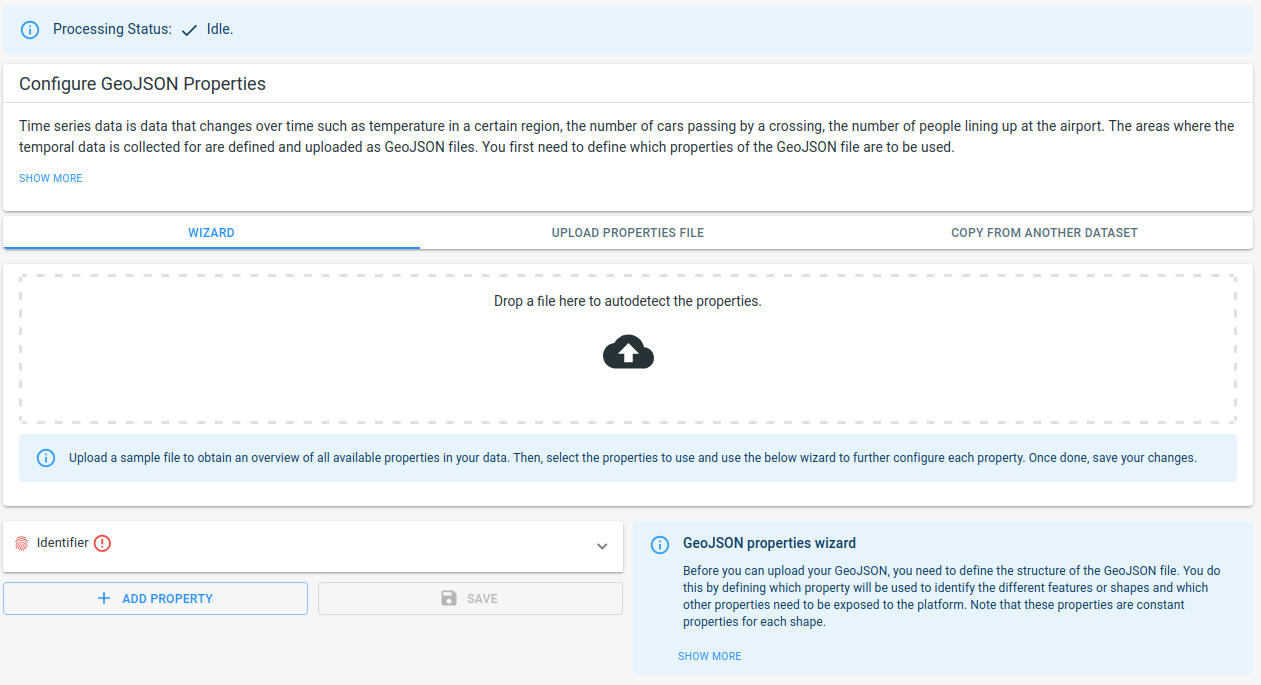
Figure 4. Different steps to define a new time series data set
Each of the steps you will need to do next is represented by an item in the navigation bar at the top of the page.
You see that the first step General settings is already completed. If you click on it, a page opens where you can adjust the name, description and tracked asset type we just filled in.
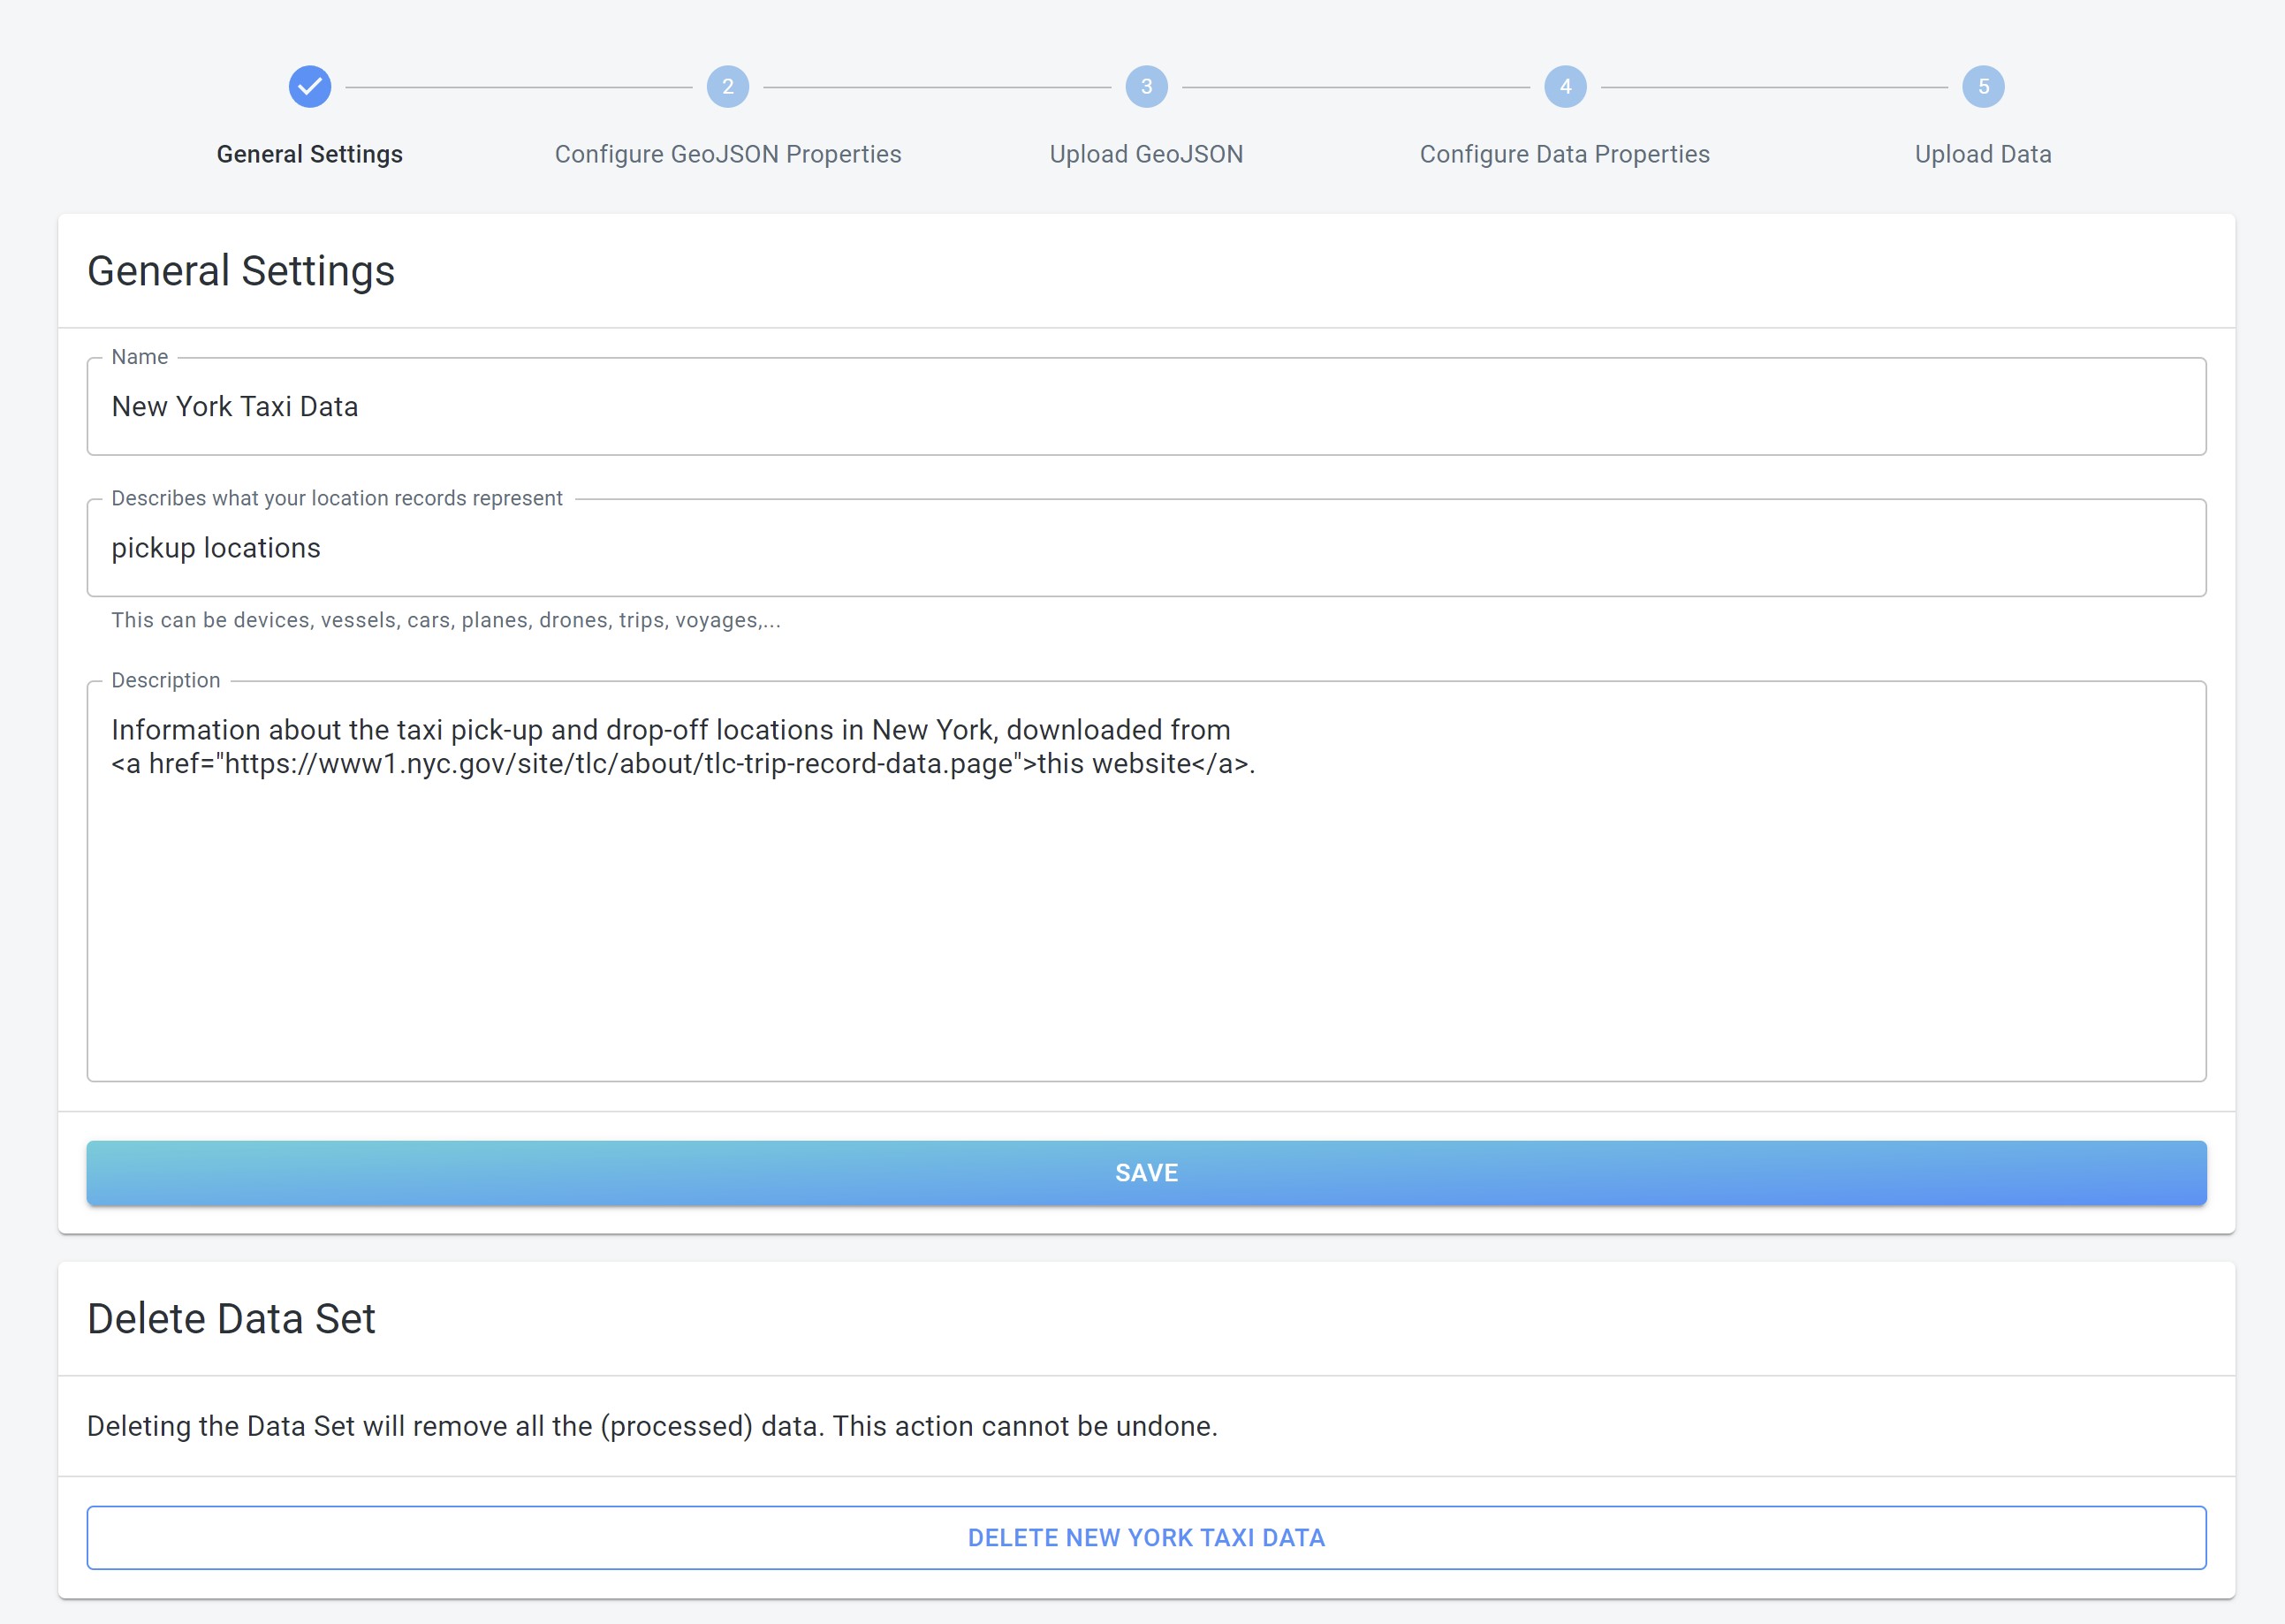
Figure 5. The first step is to configure the general settings.
Clicking on the different steps in the navigation bar on the top allows you to go back and forth, or do the steps out-of-order. Steps that are not possible to complete before another will be disabled.
Next part
Go to the next part: Step 2: Define the geometry properties
Got feedback? Additional questions? Just want to have a friendly chat?
Get in touch!