Got feedback? Additional questions? Just want to have a friendly chat?
Get in touch!
Available parts
- Goal
- Step 0: Obtain data
- Step 1: Create data set
- Step 2: Define the geometry properties
- Step 3: Upload the geojson file
- Step 4: Define csv data structure (current)
- Step 5: Upload the csv file
- Step 6: Use your data set
- Further reading
Step 4: Define the structure of the CSV files
Now that the GeoJSON with the areas have been uploaded, you can start at getting your measurements in.
Just like with the GeoJSON file, you first have to inform the platform about the structure of your .csv files.
-
The platform must know in which column the area identifier is stored, so it knows to which area the row belongs.
-
The platform must know in which column the timestamp is stored.
-
If you want to analyze any additional properties, you also need to indicate in which columns those properties are stored and whether they are numbers, categorical properties (enumerations), or free strings.
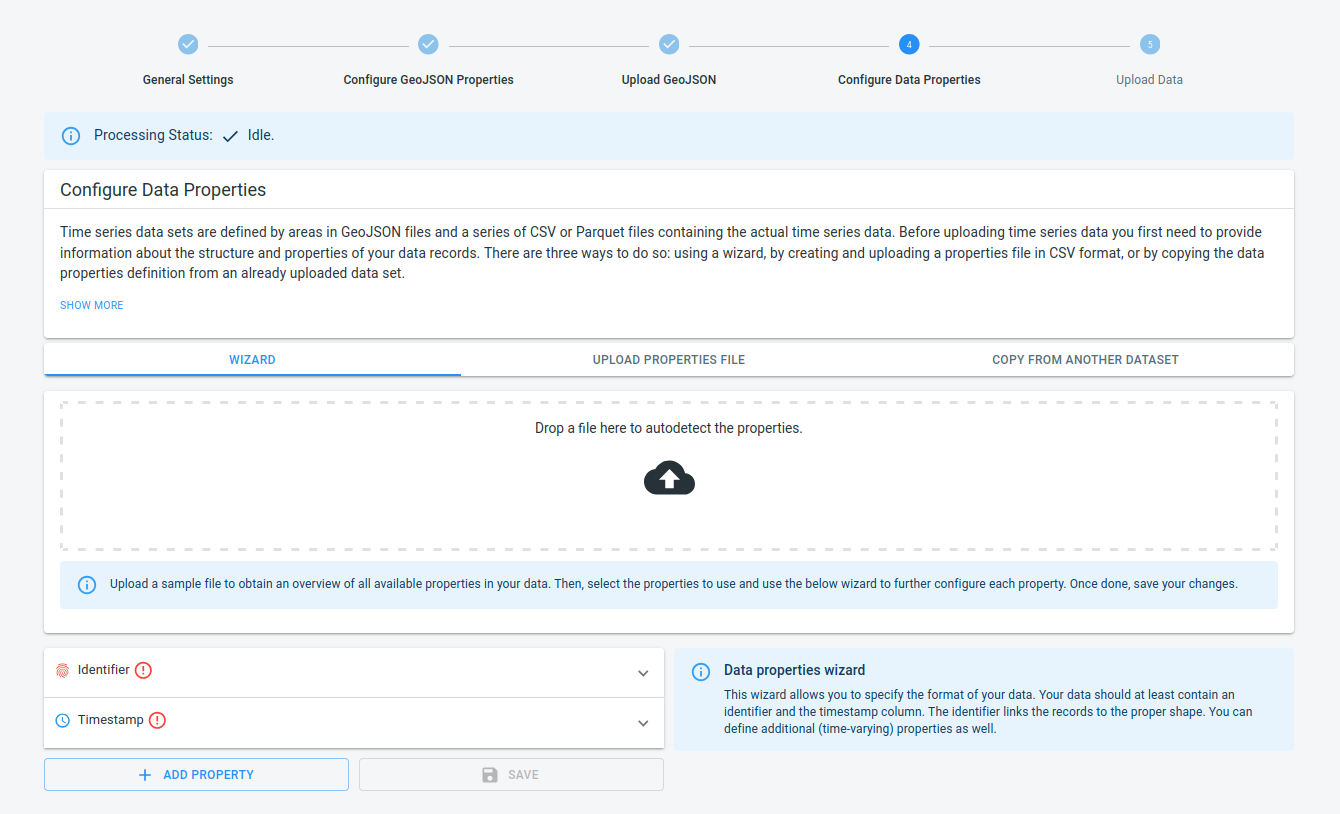
Step 4.1: Navigate to the Configure Data Properties step
by clicking on the Configure Data Properties button in the navigation bar
Figure 1. Configuring the data properties.
Step 4.2: Gather information about your data set
Let us first understand the structure of the data that we will upload.
The Yellow Taxi data that you are using in this tutorial is described here.
For each of the columns you want to use for analysis or filtering, you need to identify:
-
The index of the column in the CSV file. For example the pick-up times are stored in the second column.
-
How the data is stored in the CSV file: is it a number, is it a decimal number, is it a string, …
|
Auto-detect the available properties
When you don’t know which properties are present in your file, you can also upload the file to inspect and select which properties you want to include. See this article for more information. |
Step 4.3: Use the wizard to configure the required properties
Now that you have all the information about the data set, you can provide this info to the platform. This tutorial uses the wizard for this.
The wizard shows the two required properties to be configured:
-
Identifier: each row in the
.csvfiles represents a taxi ride between a pick-up and a drop-off location. Those locations are specified using an id which refers to a location from the GeoJSON file uploaded earlier.In this tutorial you are looking at the pick-ups, so you will have to tell the platform which column contains the identifier of the pick-up location.
-
Timestamp: each pick-up was done at a specific time. The platform needs to know in which column this pick-up time is stored.
|
The wizard has context-sensitive help messages
The info box on the right-hand side of the wizard contains some additional information. This information updates based on the property you are currently editing. |
Identifier
The identifier of the pick-up location is stored in the PULocationID column (8th column).
Click on the Identifier button in the wizard and add that information to the correct fields:
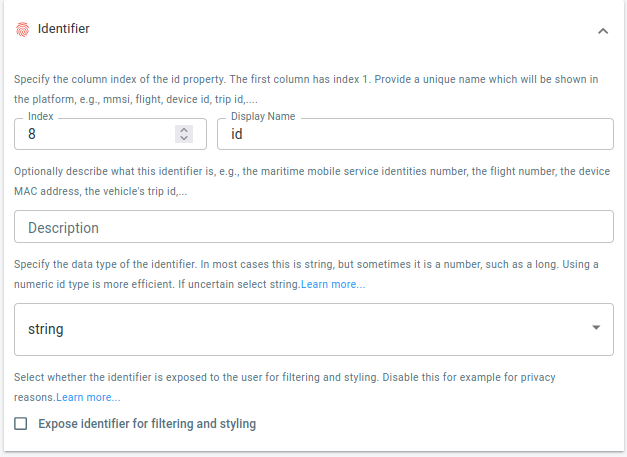
Figure 2. The pick-up location id is in the 8th column in the CSV files.
Timestamp
The same needs to be done for the timestamp.
The pick-up times are stored in the tpep_pickup_datetime column, which is column 2.
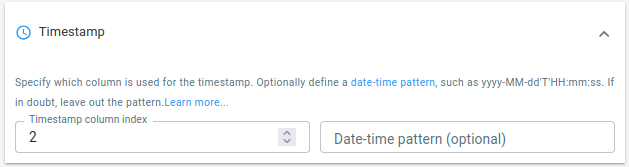
Figure 3. The timestamps are in the 2th column in the CSV files.
The times are stored using a standard string representation (YYYY-MM-DD:HH-MM-SS), so there is no need to define a custom pattern.
Step 4.4: Use the wizard to configure additional properties
If you stopped here, you will only have access to the location and timestamps during analysis. Most likely, you will want to make some additional properties available.
For this tutorial, you can for example add:
-
The total amount: available in column 17. It is stored as a number and represents the total amount paid (in USD) for the trip.
-
The payment type: available in column 10. It is stored as a number, but represents an enumeration. For example 1 means Credit Card, 2 means cash, … .
-
The passenger count: available in column 4 as an integer.
-
The trip distance: available in column 5. It is stored as a decimal number.
|
More details about the type of the column available
If you are unsure what the data type for your column is, consult the help on the right-hand side of the wizard. We also have an additional article with more guidance available. |
The total amount
Press the ADD PROPERTY button and fill in the details for the trip total amount paid property. Set 17 as Index and choose float as data type for the column.
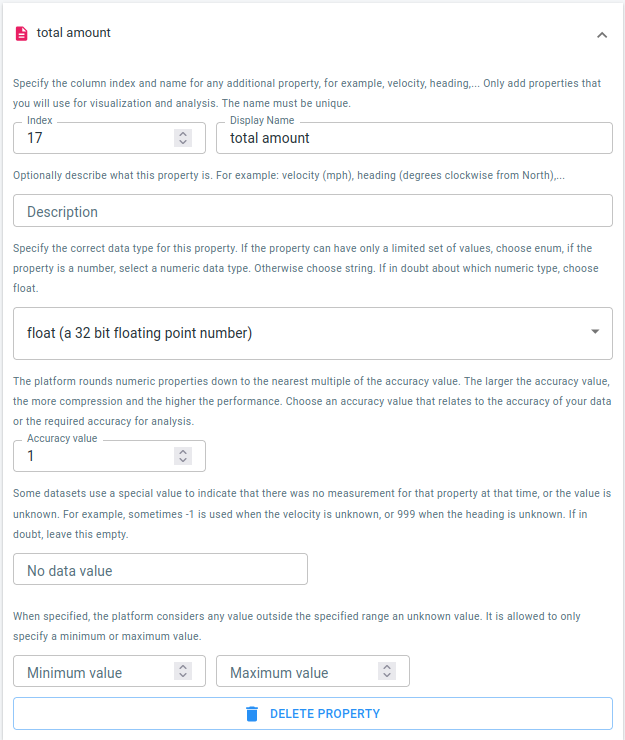
Figure 4. The trip total amount paid is in the 17th column.
This is a numeric property, so you have to select an accuracy value.
The analytics engine rounds numeric properties down to the nearest multiple of the accuracy value. For example if you define the accuracy value for the total amount to 1, the analytics engine will work with rounded values to the nearest integer (rounding down).
If you would use an accuracy value of for example 10 (USD), you will not be able to distinguish between a taxi ride of 7 USD and 8 USD. On the other hand, choosing an accuracy of for example 0.001 (USD) is pointless, as trip fares are not accurate up to 1 thousand of a dollar.
In this case, using 1 as accuracy value is a good choice.
A good choice for the accuracy value depends on two things:
-
The accuracy you want to have available during the analysis.
-
The accuracy that is available in the data: choosing a value below the accuracy used in the data makes no sense.
Using larger values is beneficial for the performance and response times of the platform. For smaller data sets however, the impact of choosing a small accuracy is negligible.
The payment type
Press the ADD PROPERTY button at the bottom of the wizard, and fill in the details for this new property. Choose enum as data type for the column.
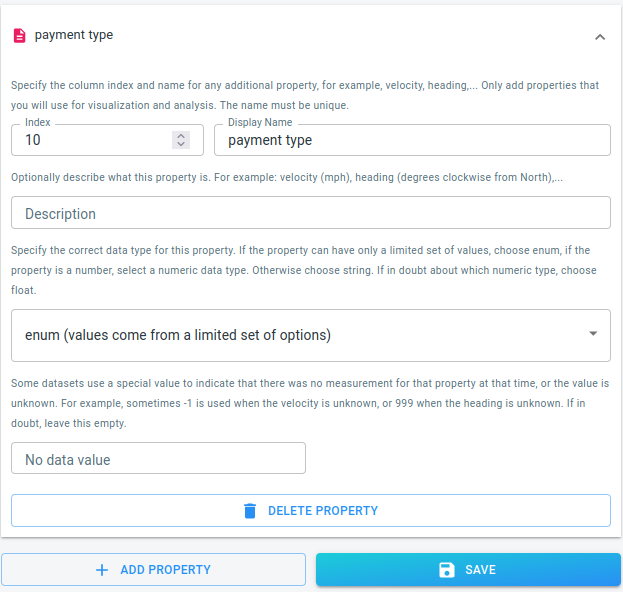
Figure 5. The payment type is in the 10th column.
The passenger count
Press the ADD PROPERTY button again, and repeat. Choose integer as data type for the column.
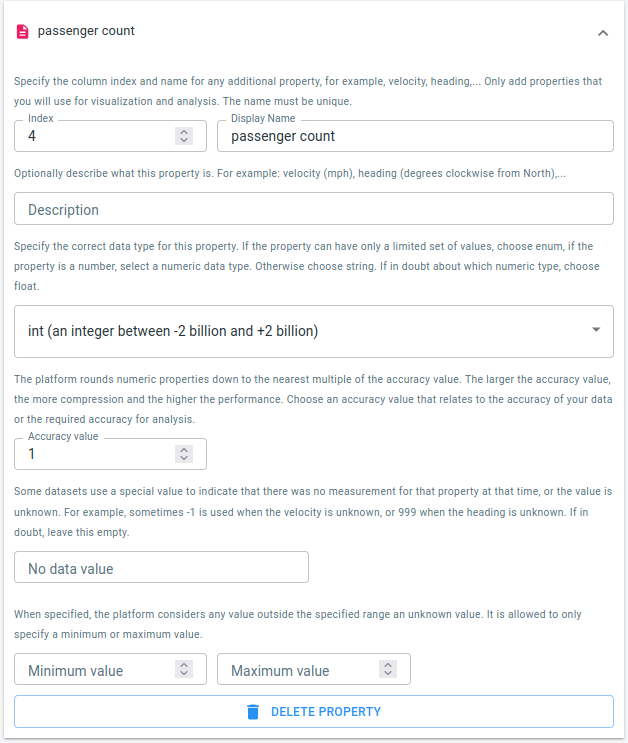
Figure 6. The passenger count is in the 4th column.
As this is a numeric property, you also need to define an accuracy value, as shown in the screenshot. Use 1 to be able to distinguish between trips with 1, 2, 3, etc. passengers.
The trip distance
Press the ADD PROPERTY button one more time, and this time fill in the details for the trip distance property. Set 5 as Index and choose float as data type for the column.
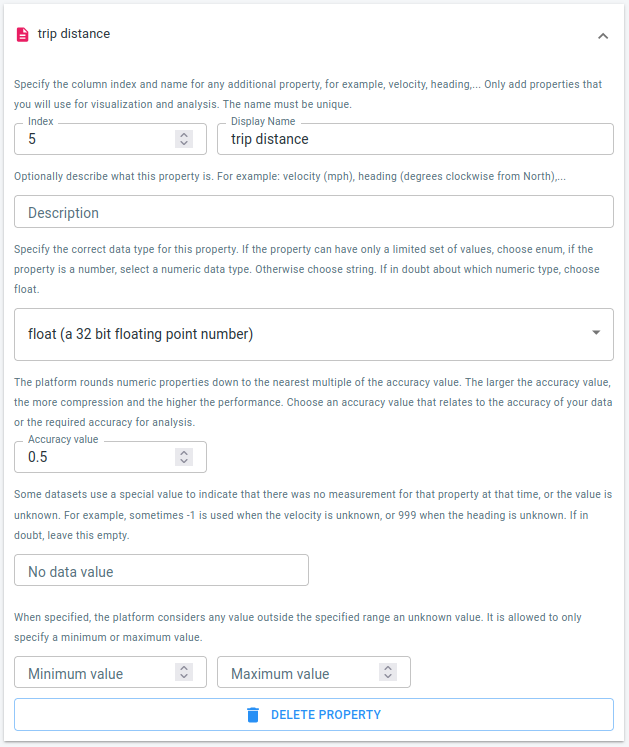
Figure 7. The trip distance is in the 5th column.
This is once again a numeric property, so you also have to select an accuracy value. This time, you could for example choose 0.5 to work with trip distances rounded down to half a mile.
Step 4.5: Save the configuration
Now that you have filled in all the properties you want to have available for analysis, you still have to press the save button at the bottom of the wizard to save this configuration.
After you have saved the configuration, a table showing the properties of your data will appear underneath the wizard:
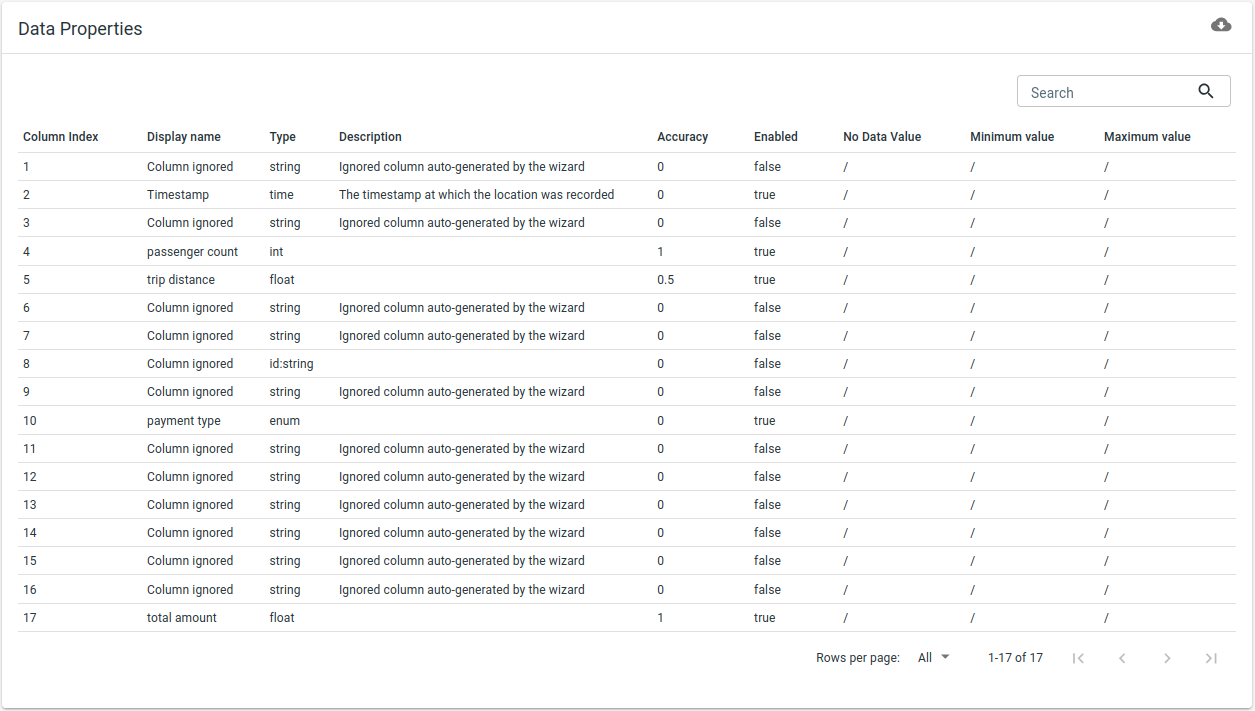
Figure 8. A table summarizes the saved data properties definition.
There are some things to note here:
-
The data properties overview shows more properties than you have configured. This is because you have indicated that the total amount property is contained in column 17. Now the platform knows your input data has at least 17 columns. The columns which you didn’t configure are present in the overview, but will be ignored.
-
At this point, it is still possible to change the properties. For example if you realize you made a mistake, you can still correct it. Once you start uploading data, it is no longer possible to make changes to the data structure.
|
Other ways of defining your data
In this tutorial we use the wizard to define the structure of the data.
You can also define this in a separate file (in This is explained in more detail here. |
Next part
Go to the next part: Step 5: Upload the csv file
Got feedback? Additional questions? Just want to have a friendly chat?
Get in touch!